Technical Analysis of OLN 2024-05-10
Overview:
In analyzing the technical indicators for OLN over the last 5 days, we will delve into the trend, momentum, volatility, and volume indicators to provide a comprehensive outlook on the possible stock price movement in the coming days. By examining these key indicators, we aim to offer valuable insights and predictions for informed decision-making.
Trend Analysis:
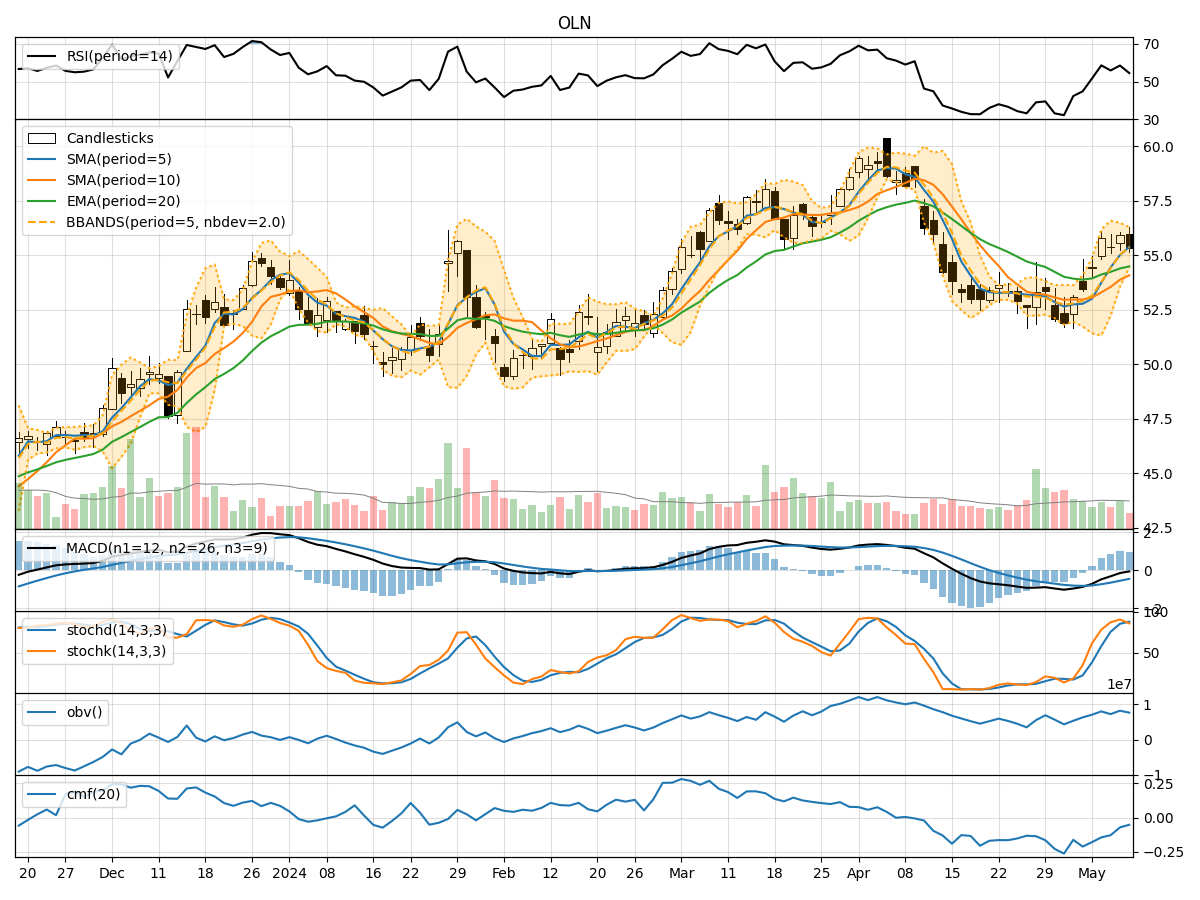
- Moving Averages (MA): The 5-day Moving Average (MA) has been consistently above the Simple Moving Average (SMA) and Exponential Moving Average (EMA), indicating a bullish trend.
- MACD: The MACD line has been below the signal line but trending upwards, suggesting a potential bullish crossover.
- Momentum: The stock price has been above the MA(5), SMA(10), and EMA(20), indicating a positive momentum in the short to medium term.
Momentum Analysis:
- RSI: The Relative Strength Index (RSI) has been fluctuating around the 50 level, indicating a neutral momentum.
- Stochastic Oscillator: Both %K and %D have been in the overbought zone, suggesting a potential reversal or consolidation.
- Williams %R: The Williams %R is in the oversold territory, indicating a possible buying opportunity.
Volatility Analysis:
- Bollinger Bands: The stock price has been trading within the Bollinger Bands, with the bands narrowing, indicating decreasing volatility.
- Bollinger %B: The %B indicator is below 1, suggesting the stock is trading below the upper band.
Volume Analysis:
- On-Balance Volume (OBV): The OBV has been fluctuating, indicating mixed buying and selling pressure.
- Chaikin Money Flow (CMF): The CMF has been negative, suggesting a bearish money flow.
Conclusion:
Based on the analysis of the technical indicators: - Trend: The stock is in an upward trend supported by moving averages and MACD. - Momentum: The momentum is neutral to slightly bullish based on RSI and Stochastic Oscillator. - Volatility: Volatility is decreasing, indicating a possible consolidation phase. - Volume: The volume indicators suggest mixed sentiment with a bearish money flow.
Overall View:
Considering the overall technical analysis, the stock of OLN is likely to experience sideways movement or consolidation in the coming days. Traders may observe for a potential breakout or breakdown from the current range to determine the next significant price direction. It is advisable to monitor key support and resistance levels for potential entry or exit points.
Disclaimer:
Remember that technical analysis is not a guaranteed predictor of future price movements, and other fundamental factors can influence stock prices. It is essential to conduct thorough research and consider multiple indicators before making any investment decisions. Consulting with a financial advisor is recommended for personalized guidance tailored to individual investment goals and risk tolerance levels.