Technical Analysis of OR 2024-05-10
Overview:
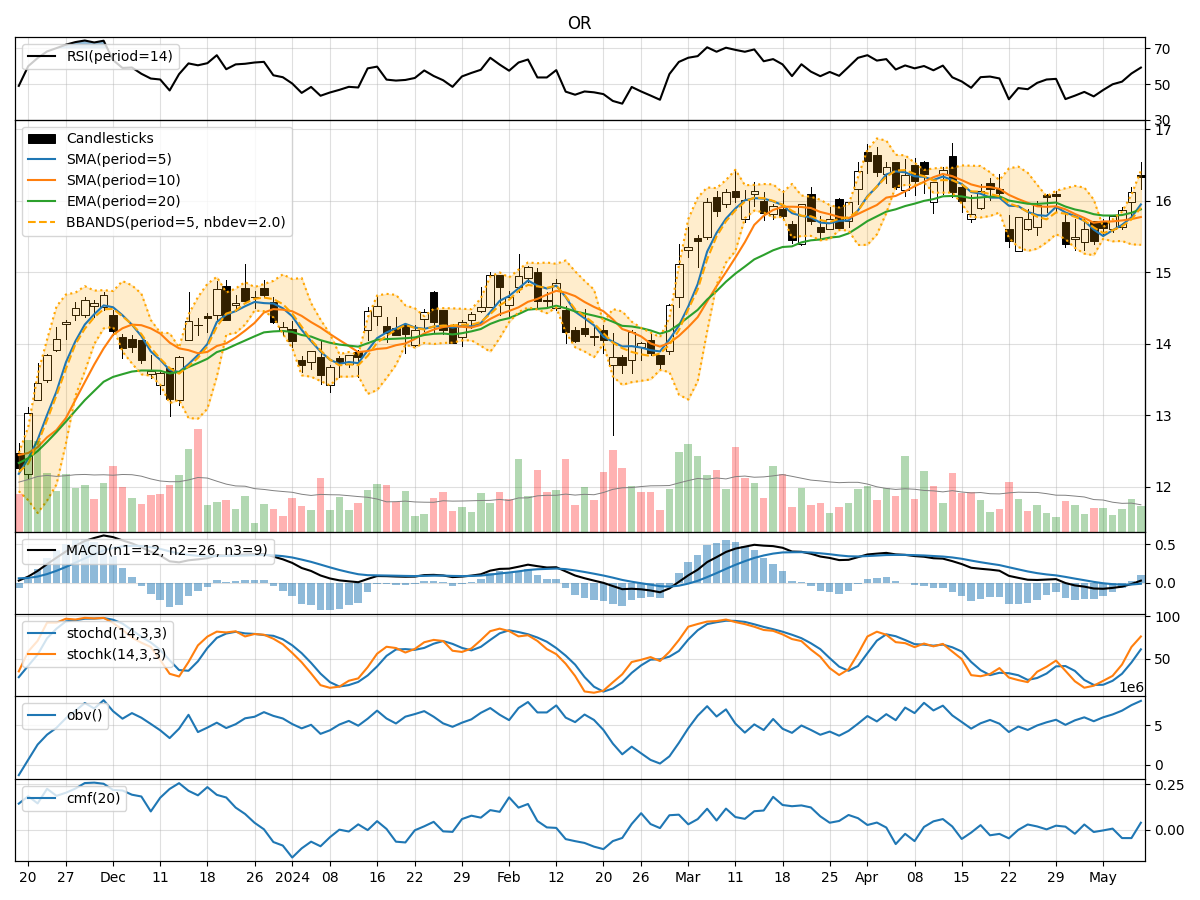
In the last 5 trading days, the stock price has shown a gradual increase from 15.62 to 16.34. Various technical indicators have been analyzed to provide insights into the possible future movement of the stock price. The analysis includes trend indicators, momentum indicators, volatility indicators, and volume indicators.
Trend Indicators:
- Moving Averages (MA): The 5-day Moving Average (MA) has been consistently increasing, indicating a bullish trend in the short term.
- MACD: The MACD line has been positive for the last few days, suggesting a bullish momentum.
- EMA: The Exponential Moving Average (EMA) has also been on an upward trend, supporting the bullish outlook.
Momentum Indicators:
- RSI: The Relative Strength Index (RSI) has been increasing, showing strengthening momentum.
- Stochastic Oscillator: Both %K and %D have been rising, indicating increasing buying pressure.
- Williams %R: The Williams %R is in the oversold region, suggesting a potential reversal to the upside.
Volatility Indicators:
- Bollinger Bands (BB): The Bollinger Bands have been widening, indicating increased volatility in the stock price.
- BB% (Bollinger Bands %B): The %B is below 1, suggesting the stock is trading below the lower Bollinger Band, potentially indicating an oversold condition.
Volume Indicators:
- On-Balance Volume (OBV): The OBV has been increasing, indicating higher buying volume in the stock.
- Chaikin Money Flow (CMF): The CMF has been fluctuating but is currently negative, suggesting some selling pressure.
Key Observations and Opinions:
- Trend: The trend indicators suggest a bullish sentiment in the short term, supported by the moving averages and MACD.
- Momentum: Momentum indicators like RSI and Stochastic Oscillator indicate a strengthening momentum towards the upside.
- Volatility: The widening Bollinger Bands and %B below 1 indicate increased volatility and a potential oversold condition.
- Volume: The increasing OBV suggests higher buying volume, while the negative CMF indicates some selling pressure.
Conclusion:
Based on the analysis of the technical indicators, the stock is likely to experience further upward movement in the next few days. The bullish trend, positive momentum, and increasing buying volume support this outlook. However, traders should be cautious of the increased volatility and monitor for any signs of reversal. Overall, the stock shows strong potential for continued bullish momentum in the near term.