Technical Analysis of ORCL 2024-05-10
Overview:
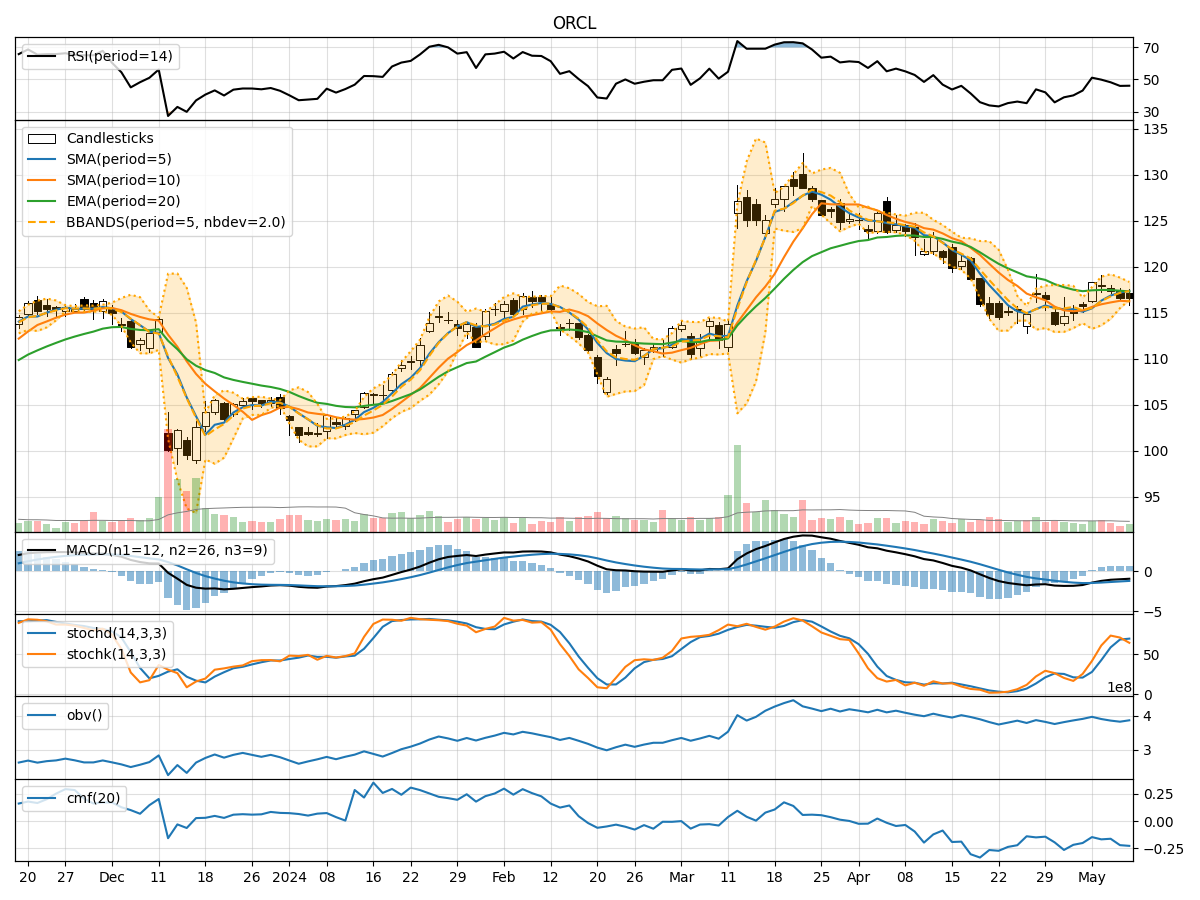
In analyzing the technical indicators for Oracle Corporation (ORCL) over the last 5 days, we will delve into the trends, momentum, volatility, and volume indicators to provide a comprehensive outlook on the possible stock price movement. By examining these key aspects, we aim to offer valuable insights and predictions for the upcoming days.
Trend Analysis:
- Moving Averages (MA): The 5-day Moving Average (MA) has been consistently above the Simple Moving Average (SMA) and Exponential Moving Average (EMA) over the past 5 days, indicating a bullish trend.
- MACD: The Moving Average Convergence Divergence (MACD) has shown a positive trend, with the MACD line consistently above the Signal line, suggesting bullish momentum.
Momentum Analysis:
- RSI: The Relative Strength Index (RSI) has been fluctuating around the 50 level, indicating a lack of strong momentum in either direction.
- Stochastic Oscillator: The Stochastic indicators have shown mixed signals, with the %K line crossing the %D line, suggesting potential indecision in the market.
Volatility Analysis:
- Bollinger Bands: The Bollinger Bands have been narrowing, indicating decreasing volatility in the stock price.
Volume Analysis:
- On-Balance Volume (OBV): The OBV has been declining over the past 5 days, suggesting a decrease in buying pressure.
- Chaikin Money Flow (CMF): The CMF has also been negative, indicating a lack of strong inflow of money into the stock.
Key Observations:
- The trend indicators suggest a bullish sentiment in the short term.
- Momentum indicators show a lack of strong momentum in either direction.
- Volatility has been decreasing, indicating a potential period of consolidation.
- Volume indicators point towards a decrease in buying pressure and lack of strong inflow of money.
Conclusion:
Based on the analysis of the technical indicators, the next few days for ORCL stock price movement are likely to be sideways or consolidation with a slight bullish bias. Traders should closely monitor key support and resistance levels for potential breakout or breakdown scenarios. It is advisable to wait for more confirmation from the indicators before making significant trading decisions.