Technical Analysis of OSK 2024-05-10
Overview:
In analyzing the technical indicators for OSK stock over the last 5 days, we will delve into the trend, momentum, volatility, and volume indicators to provide a comprehensive outlook on the possible stock price movement in the coming days. By examining these key indicators, we aim to offer valuable insights and predictions for potential investors.
Trend Indicators:
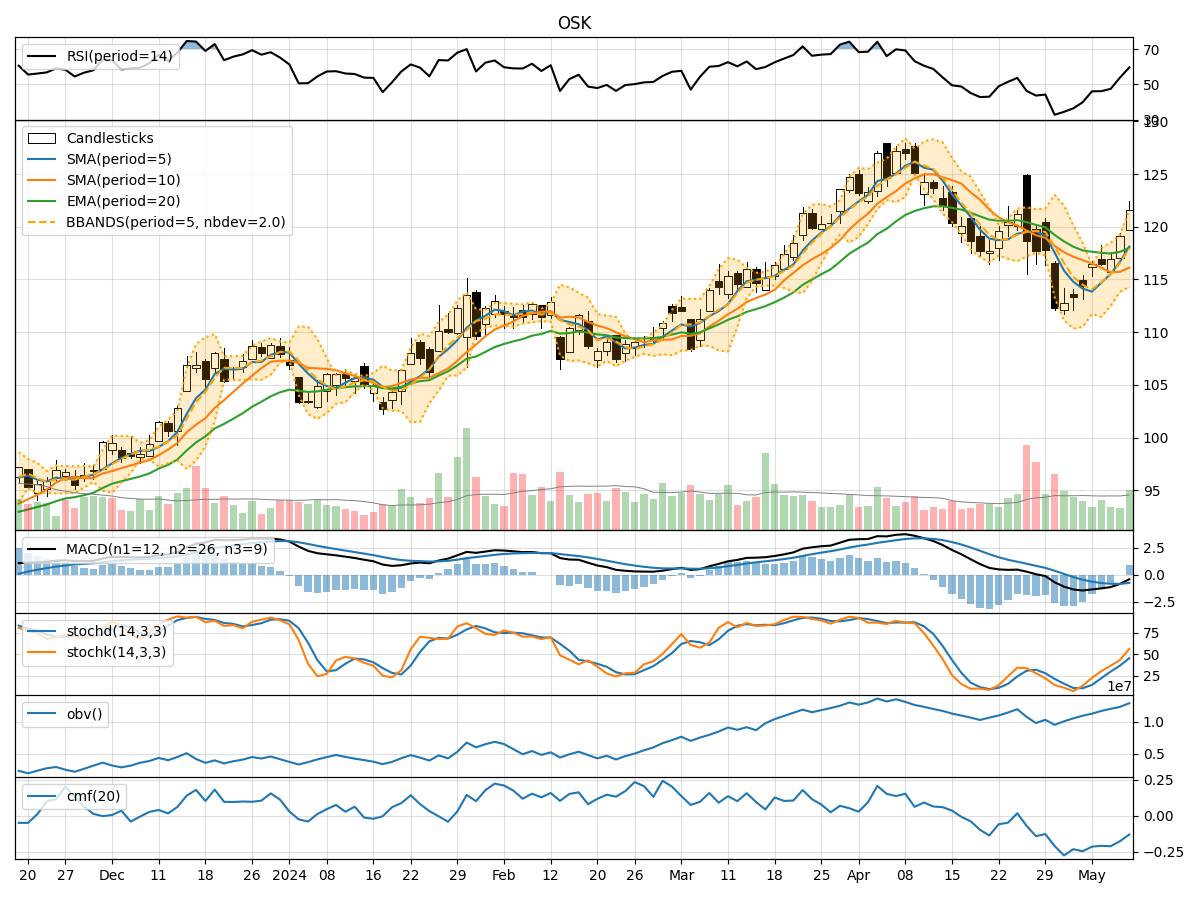
- Moving Averages (MA): The 5-day moving average has been consistently rising, indicating a bullish trend in the short term.
- MACD: The MACD line has been increasing, and the MACD histogram has turned positive, suggesting a strengthening bullish momentum.
- EMA: The exponential moving average has been trending upwards, supporting the bullish sentiment.
Momentum Indicators:
- RSI: The Relative Strength Index has been climbing, reaching the overbought territory, signaling a strong bullish momentum.
- Stochastic Oscillator: Both %K and %D lines have been rising, indicating increasing buying pressure and positive momentum.
- Williams %R: The indicator has been moving towards the oversold region, suggesting a potential reversal to the upside.
Volatility Indicators:
- Bollinger Bands: The stock price has been consistently trading above the middle Bollinger Band, indicating an uptrend with increased volatility.
- Bollinger %B: The %B indicator has been hovering around 1, suggesting that the stock is trading at the upper Bollinger Band, indicating a potential overbought condition.
Volume Indicators:
- On-Balance Volume (OBV): The OBV has been steadily increasing, reflecting strong buying volume in the stock.
- Chaikin Money Flow (CMF): The CMF has been negative, indicating some selling pressure, but the recent uptrend in OBV suggests accumulating volume.
Key Observations and Opinions:
- Trend: The trend indicators point towards a strong bullish sentiment in the short term.
- Momentum: Momentum indicators suggest a robust buying momentum with potential overbought conditions.
- Volatility: Volatility indicators show an uptrend with increased price fluctuations.
- Volume: The increasing OBV indicates strong buying interest, while the CMF suggests some selling pressure.
Conclusion:
Based on the analysis of the technical indicators, the next few days for OSK stock are likely to see continued upward movement. The bullish trend, strong momentum, and increasing buying volume indicate a positive outlook for the stock price. However, investors should be cautious of potential overbought conditions and increased volatility. It is advisable to closely monitor the price action and key support/resistance levels for timely decision-making.