Technical Analysis of PAG 2024-05-10
Overview:
In analyzing the technical indicators for PAG over the last 5 days, we will delve into the trend, momentum, volatility, and volume indicators to provide a comprehensive outlook on the possible stock price movement in the coming days.
Trend Analysis:
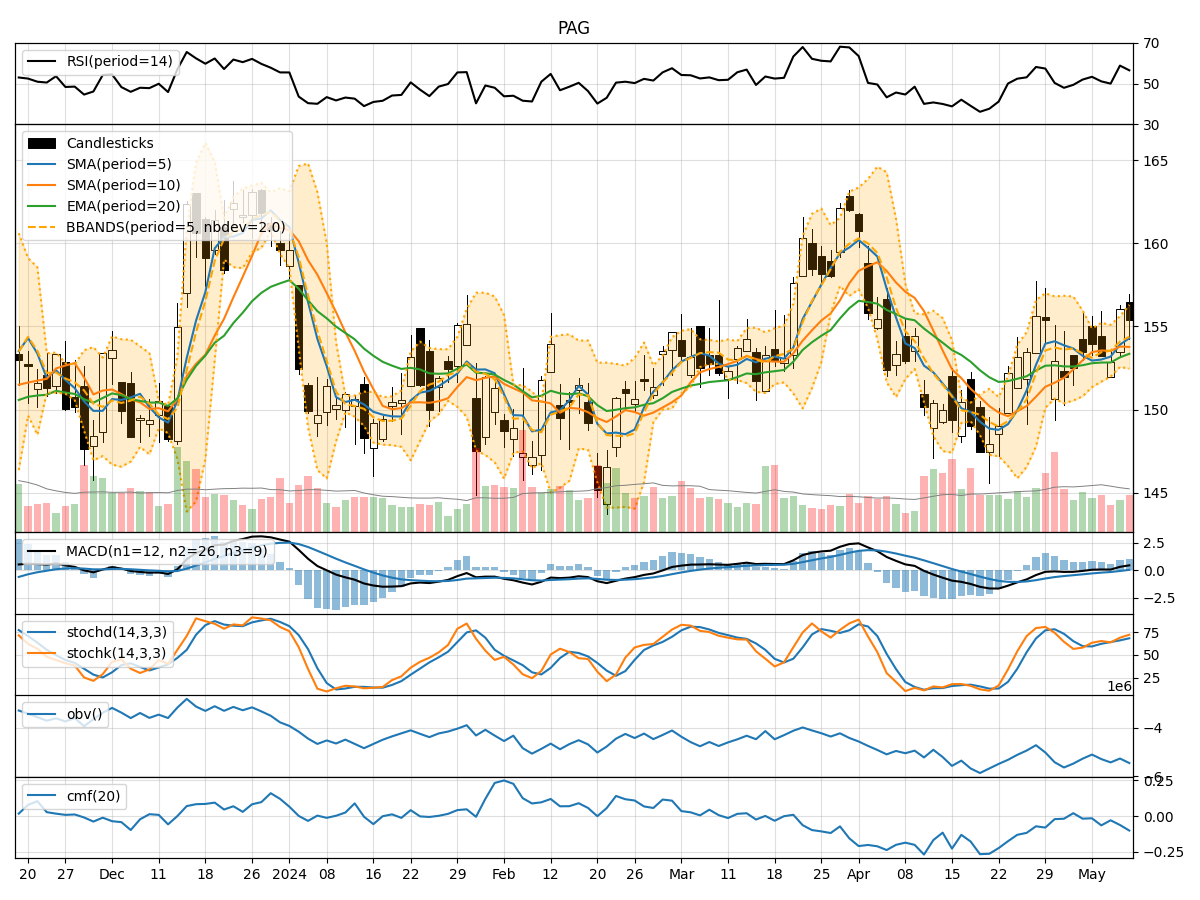
- Moving Averages (MA): The 5-day MA has been fluctuating around the closing prices, indicating short-term price trends. The SMA(10) and EMA(20) have shown slight variations but have not diverged significantly.
- MACD: The MACD line has been positive for the past few days, indicating a bullish momentum. The MACD Histogram has been increasing, suggesting strengthening bullish momentum.
Momentum Analysis:
- RSI: The RSI has been hovering around the mid-level, indicating a neutral stance in momentum.
- Stochastic Oscillator: Both %K and %D have been in the overbought zone, suggesting a potential reversal in the short term.
- Williams %R: The Williams %R has been fluctuating in the oversold and overbought zones, indicating mixed momentum signals.
Volatility Analysis:
- Bollinger Bands: The stock price has been trading within the Bollinger Bands, with the bands widening slightly, indicating increased volatility.
- Bollinger %B: The %B indicator has been fluctuating around 0.5, suggesting the stock is trading around the middle band.
Volume Analysis:
- On-Balance Volume (OBV): The OBV has shown mixed signals with fluctuations in volume, indicating indecision among market participants.
- Chaikin Money Flow (CMF): The CMF has been negative, indicating selling pressure in the stock.
Key Observations:
- The trend indicators suggest a bullish sentiment with the MACD showing positive momentum.
- Momentum indicators show mixed signals with the RSI neutral, Stochastic in the overbought zone, and Williams %R fluctuating.
- Volatility has increased slightly, as seen in the widening Bollinger Bands.
- Volume indicators reflect indecision among investors with OBV showing mixed signals and CMF indicating selling pressure.
Conclusion:
Based on the analysis of the technical indicators, the stock price of PAG is likely to experience further upward movement in the coming days. The bullish trend indicated by the MACD and the positive momentum signals outweigh the mixed signals from the momentum and volume indicators. The increased volatility may lead to short-term fluctuations, but the overall trend remains bullish. Traders and investors could consider buying opportunities in PAG based on the current technical analysis.