Technical Analysis of PAGS 2024-05-10
Overview:
In analyzing the technical indicators for PAGS over the last 5 days, we will delve into the trend, momentum, volatility, and volume indicators to provide a comprehensive outlook on the possible stock price movement. By examining these key indicators, we aim to offer valuable insights and predictions for the upcoming days.
Trend Analysis:
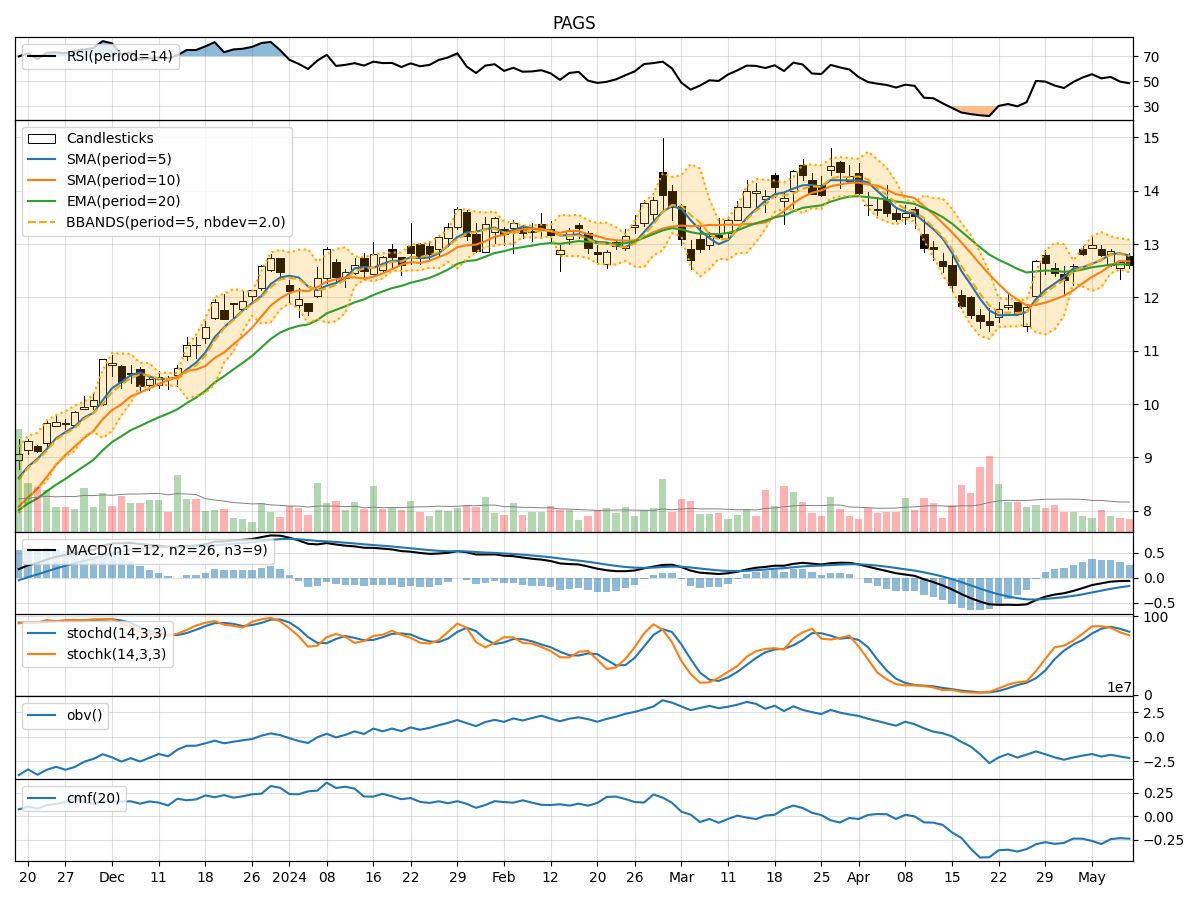
- Moving Averages (MA): The 5-day Moving Average (MA) has been fluctuating around the closing prices, indicating short-term price trends. The Simple Moving Average (SMA) and Exponential Moving Average (EMA) show a slight upward trend, suggesting potential bullish momentum.
- MACD: The Moving Average Convergence Divergence (MACD) has been positive but decreasing, indicating a potential slowdown in bullish momentum.
- MACD Histogram: The MACD Histogram has been positive, but the decreasing values suggest a weakening bullish trend.
Momentum Analysis:
- RSI: The Relative Strength Index (RSI) has been fluctuating around the neutral zone, indicating indecision in the market.
- Stochastic Oscillator: Both %K and %D of the Stochastic Oscillator have been declining, signaling a potential bearish momentum shift.
- Williams %R: The Williams %R is in the oversold territory, suggesting a possible reversal in the short term.
Volatility Analysis:
- Bollinger Bands: The Bollinger Bands have been narrowing, indicating decreasing volatility and a potential price breakout in the near future.
- Bollinger %B: The %B indicator is hovering around the middle range, suggesting a balanced market sentiment.
- Bollinger Band Width: The Band Width has been decreasing, indicating a potential decrease in volatility.
Volume Analysis:
- On-Balance Volume (OBV): The OBV has been negative, indicating selling pressure in the market.
- Chaikin Money Flow (CMF): The CMF has been negative, suggesting outflow of money from the stock.
Conclusion:
Based on the analysis of the technical indicators, the stock of PAGS is likely to experience further downward movement in the next few days. The trend indicators show a potential weakening of the bullish momentum, supported by the declining MACD values. The momentum indicators also point towards a bearish sentiment, with the Stochastic Oscillator signaling a possible reversal. Additionally, the volume indicators reflect selling pressure in the market, further supporting a bearish outlook.
Considering the overall technical analysis, it is recommended to exercise caution and consider potential short-selling or wait for a clearer signal before entering a long position. The market dynamics suggest a bearish bias in the upcoming days for PAGS stock.