Technical Analysis of PB 2024-05-10
Overview:
In analyzing the provided technical indicators for the last 5 days, we will delve into the trend, momentum, volatility, and volume indicators to forecast the possible stock price movement for the next few days. By examining these key aspects, we aim to provide a comprehensive and insightful analysis to guide your decision-making process.
Trend Indicators:
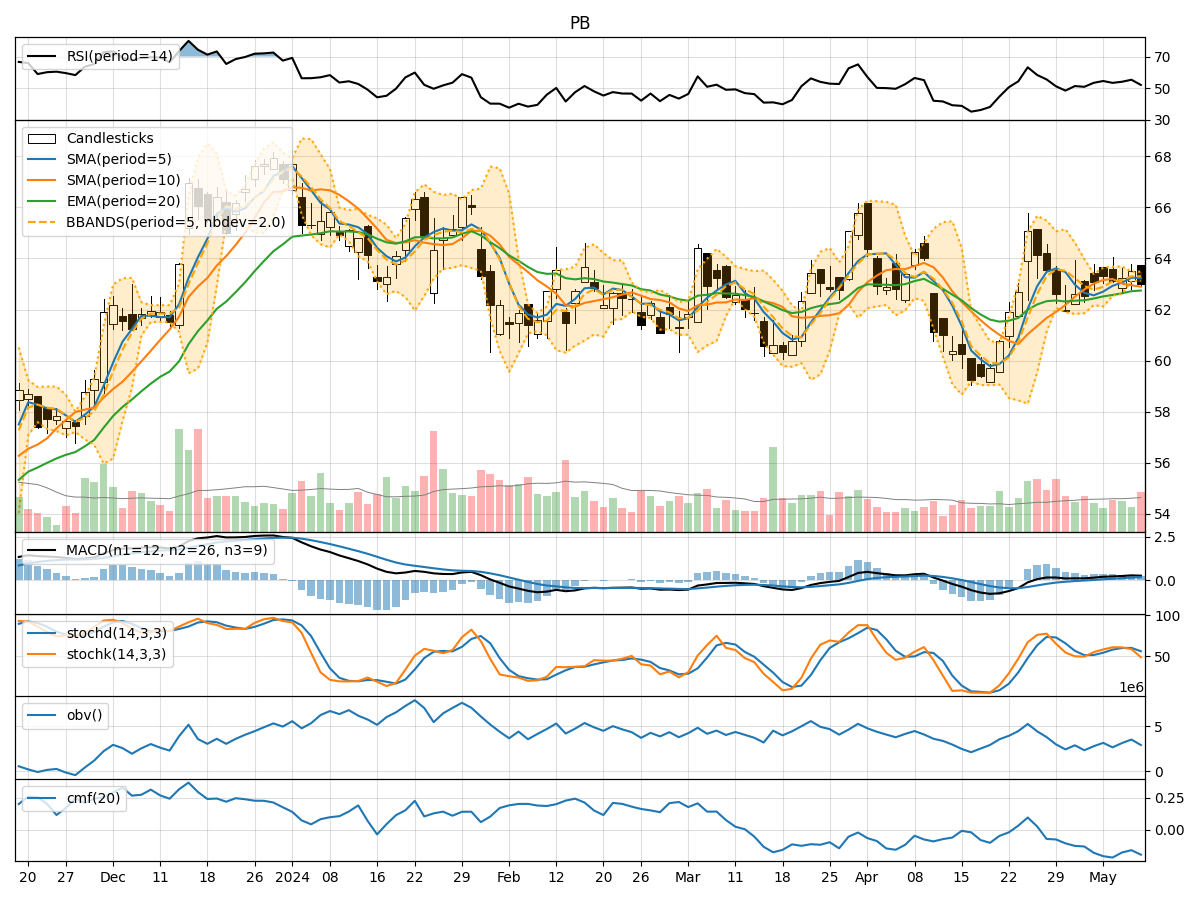
- Moving Averages (MA): The 5-day moving average (MA) has been consistently above the closing prices, indicating a short-term uptrend.
- MACD: The MACD line has been positive and increasing, suggesting bullish momentum.
- RSI: The Relative Strength Index (RSI) has been hovering around the neutral zone, indicating a balanced market sentiment.
Momentum Indicators:
- Stochastic Oscillator: The Stochastic Oscillator has shown mixed signals, with fluctuations in the %K and %D values.
- Williams %R: The Williams %R is in oversold territory, suggesting a potential reversal or buying opportunity.
Volatility Indicators:
- Bollinger Bands: The stock price has been trading within the Bollinger Bands, indicating normal volatility levels.
- BB% (Bollinger Band %B): The BB% has been fluctuating around the midline, reflecting a lack of strong trend direction.
Volume Indicators:
- On-Balance Volume (OBV): The OBV has shown mixed signals, with alternating positive and negative values.
- Chaikin Money Flow (CMF): The CMF has been negative, indicating selling pressure in the market.
Key Observations and Opinions:
- Trend: The trend indicators suggest a short-term bullish bias, supported by the positive MACD and moving averages.
- Momentum: The momentum indicators show mixed signals, with the Stochastic Oscillator indicating potential indecision in the market.
- Volatility: Volatility remains relatively stable within the Bollinger Bands, signaling a lack of significant price fluctuations.
- Volume: The volume indicators reflect a lack of strong buying or selling pressure, as seen in the alternating OBV values and negative CMF.
Conclusion:
Based on the analysis of the technical indicators, the stock is likely to experience sideways consolidation in the next few days. The mixed signals from the momentum and volume indicators, coupled with stable volatility levels, suggest a lack of clear direction in the market. Traders may expect the stock price to trade within a narrow range without a strong trend bias. It is advisable to closely monitor key support and resistance levels for potential breakout opportunities.