Technical Analysis of PBA 2024-05-10
Overview:
In analyzing the technical indicators for PBA over the last 5 days, we will delve into the trend, momentum, volatility, and volume indicators to provide a comprehensive outlook on the possible stock price movement in the coming days. By examining these key factors, we aim to offer valuable insights and predictions to guide your investment decisions.
Trend Analysis:
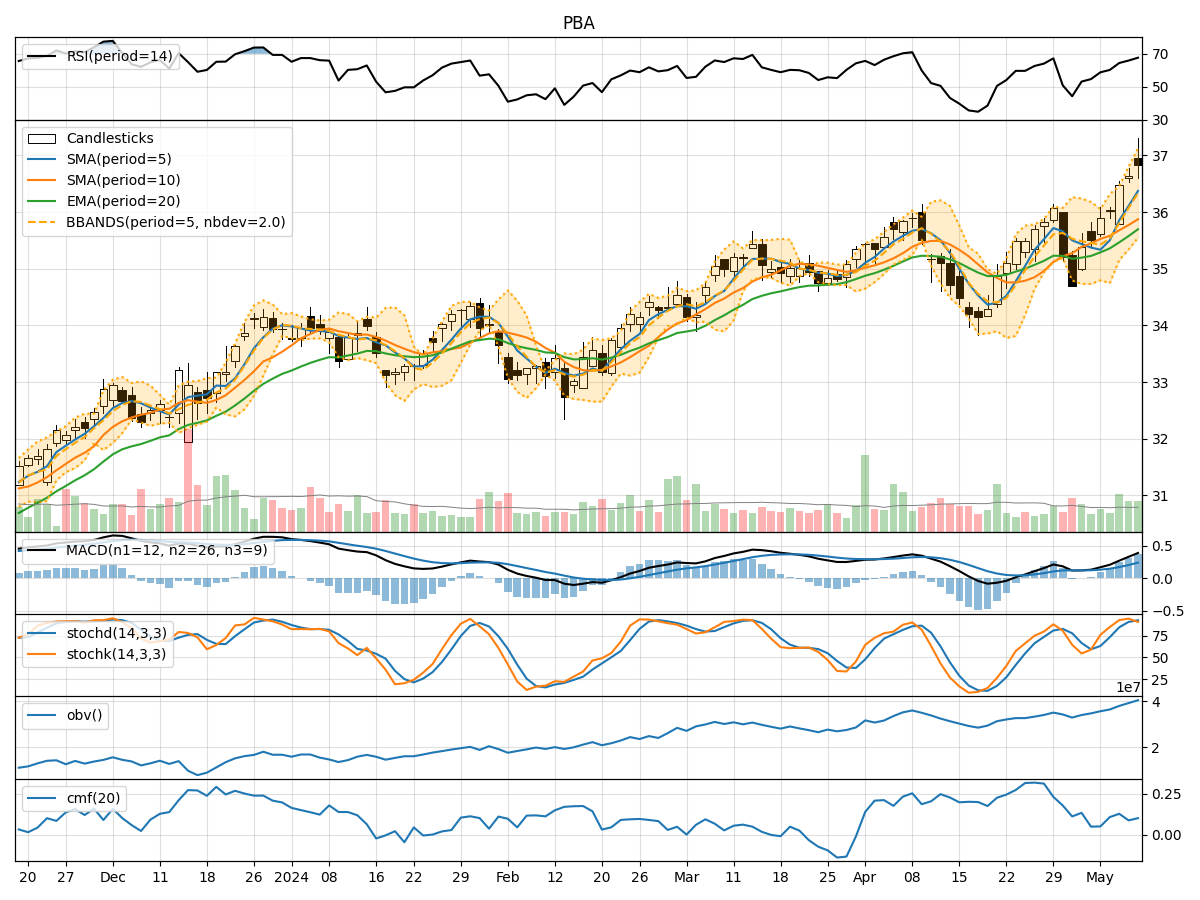
- Moving Averages (MA): The 5-day Moving Average (MA) has been consistently rising, indicating a bullish trend in the short term.
- MACD: The MACD line has been increasing, crossing above the signal line, suggesting a bullish momentum.
- EMA: The Exponential Moving Average (EMA) has been trending upwards, supporting the bullish sentiment in the stock.
Momentum Analysis:
- RSI: The Relative Strength Index (RSI) has been increasing and is currently in the overbought territory, signaling a strong bullish momentum.
- Stochastic Oscillator: Both %K and %D lines of the Stochastic Oscillator are in the overbought zone, indicating a potential reversal or consolidation.
- Williams %R: The Williams %R is in the oversold region, suggesting a possible pullback in the stock price.
Volatility Analysis:
- Bollinger Bands: The stock price has been trading within the upper Bollinger Band, indicating an overbought condition. However, the bands are widening, suggesting increased volatility.
- Bollinger %B: The %B indicator is above 0.8, indicating a potential overbought situation.
Volume Analysis:
- On-Balance Volume (OBV): The OBV has been steadily increasing, reflecting strong buying pressure in the stock.
- Chaikin Money Flow (CMF): The CMF is positive, indicating that money is flowing into the stock.
Conclusion:
Based on the technical analysis of the trend, momentum, volatility, and volume indicators, the stock is currently in a strong bullish phase. The moving averages, MACD, RSI, and OBV all suggest a positive outlook for the stock price. However, the overbought signals from the Stochastic Oscillator and Williams %R indicate a potential short-term correction or consolidation.
Forecast:
In the next few days, we can expect the stock price of PBA to continue its upward trajectory with possible short-term corrections due to overbought conditions. Traders should be cautious of potential pullbacks and use them as buying opportunities to ride the overall bullish trend. It is advisable to monitor the Stochastic Oscillator and Williams %R for signs of a reversal in momentum.
Key Recommendations:
- Long Position: Consider holding onto long positions with a trailing stop-loss to protect profits.
- Short-Term Traders: Look for opportunities to enter the market during pullbacks for quick gains.
- Risk Management: Implement proper risk management strategies to mitigate potential losses during volatile periods.
By combining technical analysis with risk management practices, investors can navigate the market dynamics effectively and capitalize on the bullish momentum of PBA stock.