Technical Analysis of PCOR 2024-05-31
Overview:
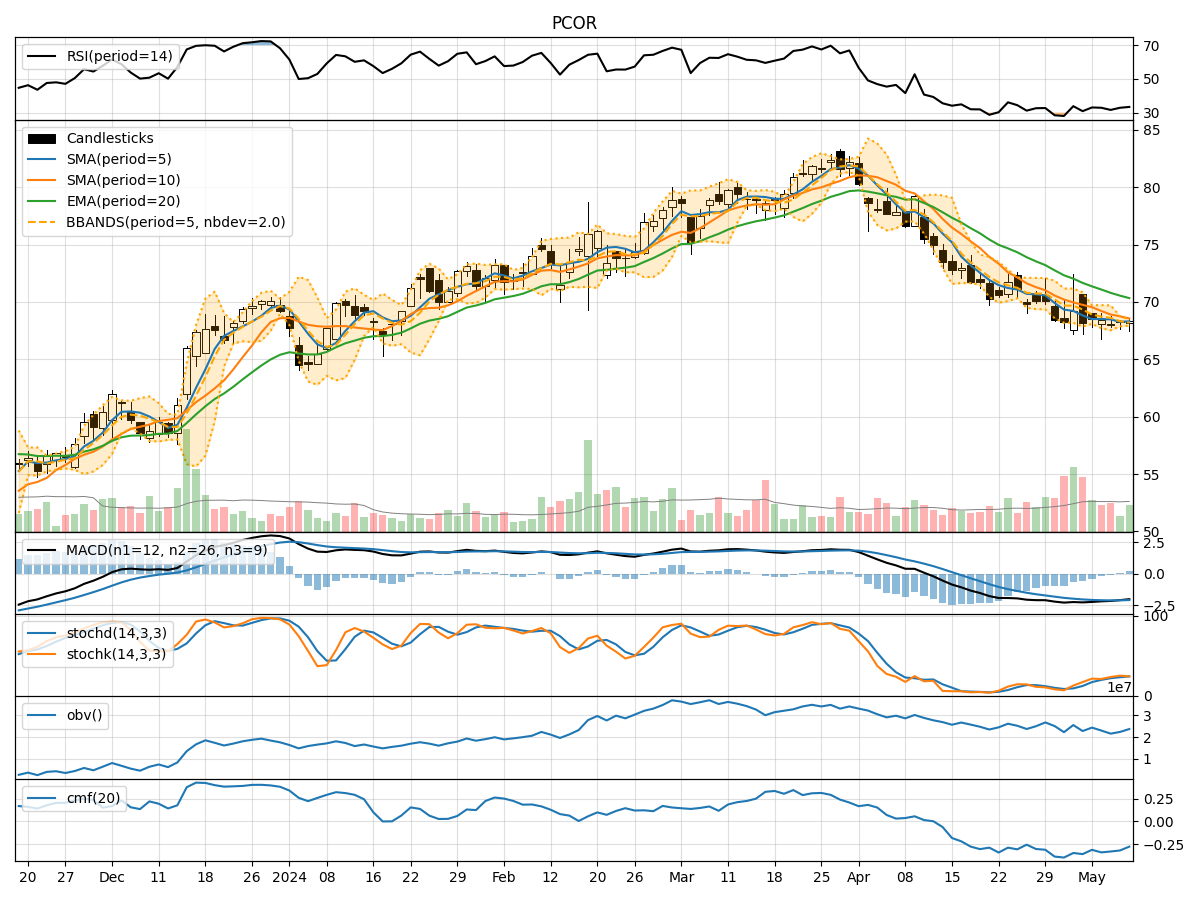
In analyzing the technical indicators for PCOR over the last 5 days, we will delve into the trends, momentum, volatility, and volume indicators to provide a comprehensive outlook on the possible stock price movement in the coming days.
Trend Analysis:
- Moving Averages (MA): The 5-day Moving Average (MA) has been consistently below the Simple Moving Average (SMA) and Exponential Moving Average (EMA) over the past 5 days, indicating a downward trend.
- MACD: The Moving Average Convergence Divergence (MACD) has been negative, with the MACD line consistently below the Signal line, suggesting bearish momentum.
Momentum Analysis:
- RSI: The Relative Strength Index (RSI) has been hovering around the mid-level, indicating a neutral sentiment in terms of momentum.
- Stochastic Oscillator: Both %K and %D have been in the oversold region, suggesting a potential reversal or consolidation phase.
Volatility Analysis:
- Bollinger Bands (BB): The stock price has been trading within the lower Bollinger Band, indicating a period of low volatility.
Volume Analysis:
- On-Balance Volume (OBV): The OBV has been consistently negative, indicating selling pressure in the stock.
- Chaikin Money Flow (CMF): The CMF has been negative, reflecting a lack of buying interest in the stock.
Key Observations:
- The stock is currently in a downtrend based on moving averages and MACD.
- Momentum indicators suggest a neutral to oversold sentiment.
- Volatility is low, indicating a lack of significant price movements.
- Volume indicators show a consistent selling pressure and lack of buying interest.
Conclusion:
Based on the analysis of the technical indicators, the outlook for PCOR in the next few days is bearish. The stock is likely to continue its downward trend, with potential for further downside movement. Traders should exercise caution and consider shorting or staying on the sidelines until a clear reversal signal is observed.