Technical Analysis of PEN 2024-05-10
Overview:
In analyzing the technical indicators for PEN stock over the last 5 days, we will delve into the trend, momentum, volatility, and volume indicators to provide a comprehensive outlook on the possible stock price movement in the coming days.
Trend Analysis:
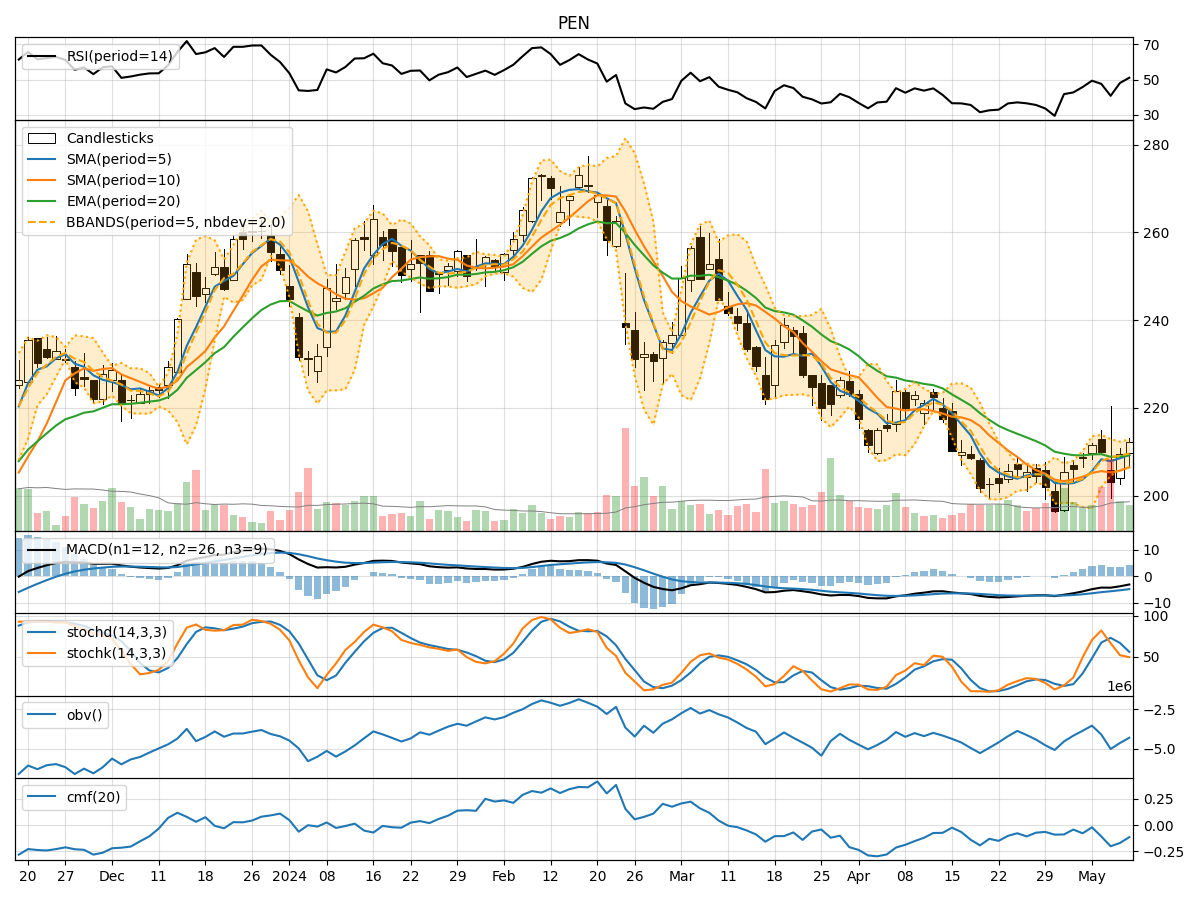
- Moving Averages (MA): The 5-day Moving Average (MA) has been consistently above the Simple Moving Average (SMA) and Exponential Moving Average (EMA) over the past 5 days, indicating a bullish trend.
- MACD: The Moving Average Convergence Divergence (MACD) has shown positive values, with the MACD line consistently above the Signal line, suggesting a bullish momentum in the short term.
Momentum Analysis:
- RSI: The Relative Strength Index (RSI) has been fluctuating around the 50 level, indicating a neutral momentum in the stock.
- Stochastic Oscillator: The Stochastic Oscillator has been moving towards oversold levels, suggesting a potential reversal in the stock's momentum.
Volatility Analysis:
- Bollinger Bands: The Bollinger Bands have shown narrowing bands, indicating decreasing volatility in the stock price.
- Bollinger %B: The %B indicator has been hovering around the middle range, signifying a neutral stance in terms of volatility.
Volume Analysis:
- On-Balance Volume (OBV): The OBV indicator has been declining over the past 5 days, suggesting a decrease in buying pressure.
- Chaikin Money Flow (CMF): The CMF has been negative, indicating a bearish money flow in the stock.
Conclusion:
Based on the analysis of the technical indicators: - Trend: The stock is currently in an upward trend based on moving averages and MACD. - Momentum: The momentum is neutral to slightly bearish based on RSI and Stochastic Oscillator. - Volatility: Volatility is decreasing based on Bollinger Bands. - Volume: The volume indicators suggest a bearish sentiment with declining OBV and negative CMF.
Overall View:
Considering the overall technical analysis, the stock is likely to experience consolidation or a slight pullback in the coming days. Traders should exercise caution and monitor key support and resistance levels for potential entry or exit points. It is advisable to wait for clearer signals or confirmation of a new trend direction before making significant trading decisions.