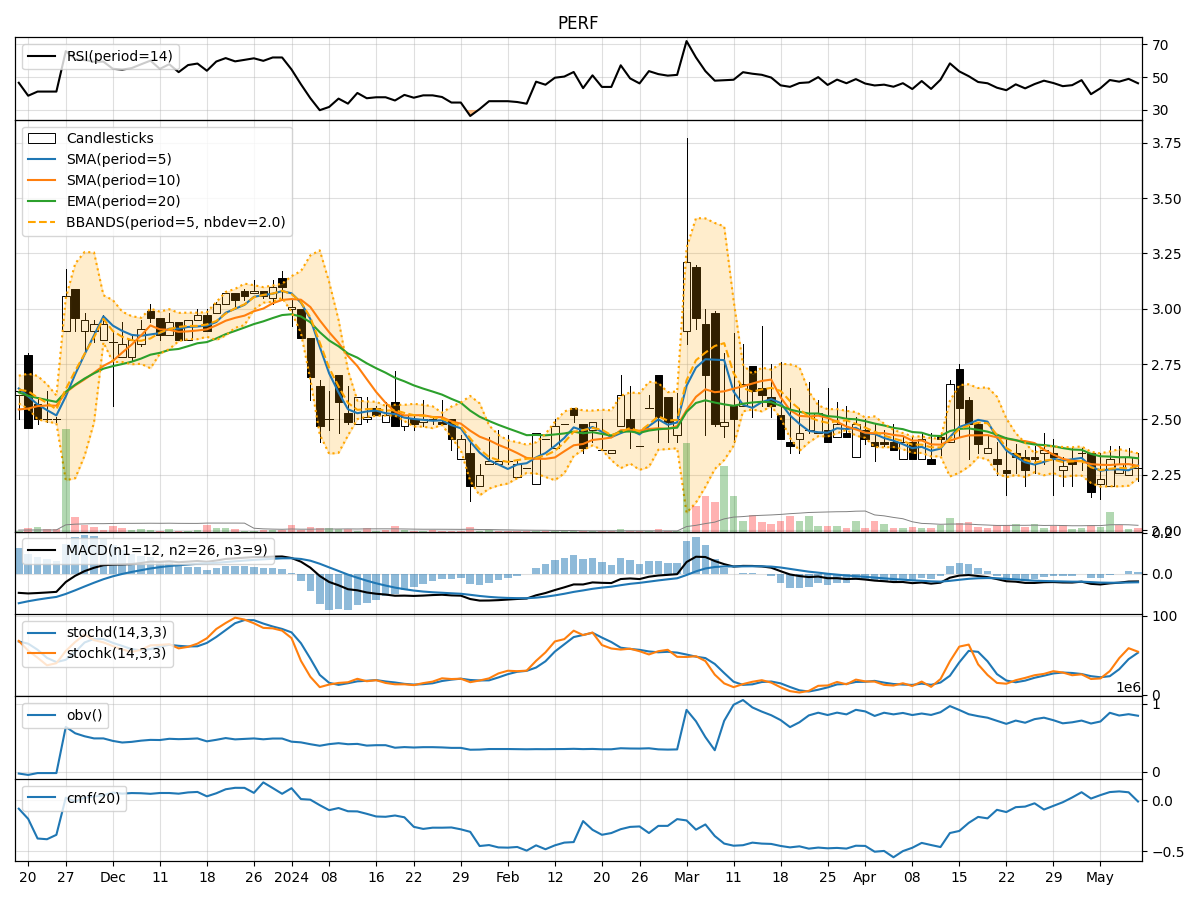
Technical Analysis of PERF 2024-05-10
Overview:
In analyzing the technical indicators for the stock PERF over the last 5 days, we will delve into the trends, momentum, volatility, and volume indicators to provide a comprehensive outlook on the possible stock price movement in the coming days. By examining these key indicators, we aim to offer valuable insights and predictions for informed decision-making.
Trend Indicators:
- Moving Averages (MA): The 5-day Moving Average (MA) has been fluctuating around the closing prices, indicating a lack of clear trend direction.
- MACD: The Moving Average Convergence Divergence (MACD) has been consistently negative, suggesting a bearish momentum in the short term.
- EMA: The Exponential Moving Average (EMA) has been declining, further supporting the bearish sentiment in the stock.
Momentum Indicators:
- RSI: The Relative Strength Index (RSI) has been hovering around the neutral zone, indicating a lack of strong buying or selling pressure.
- Stochastic Oscillator: The Stochastic indicators have shown mixed signals, with the %K and %D lines fluctuating, reflecting indecision in the market.
- Williams %R: The Williams %R is in the oversold territory, suggesting a potential reversal or consolidation phase.
Volatility Indicators:
- Bollinger Bands: The Bollinger Bands have been narrowing, indicating decreasing volatility and a possible period of consolidation.
- Bollinger %B: The %B indicator is below 0.5, signaling a potential oversold condition and a likelihood of a price bounce.
Volume Indicators:
- On-Balance Volume (OBV): The OBV has shown mixed movements, reflecting uncertainty in the buying and selling pressure.
- Chaikin Money Flow (CMF): The CMF has been positive but declining, indicating weakening buying pressure.
Key Observations and Opinions:
- Trend: The stock is currently in a bearish trend based on the MACD and EMA indicators.
- Momentum: The momentum indicators suggest a neutral to slightly bearish sentiment with no clear direction.
- Volatility: Volatility is decreasing, pointing towards a potential consolidation phase in the stock.
- Volume: The volume indicators show mixed signals, indicating uncertainty in market participation.
Conclusion:
Based on the analysis of the technical indicators, the stock PERF is likely to experience further downside pressure in the near term due to the bearish trend and lack of strong buying momentum. However, the decreasing volatility and oversold conditions on some indicators may lead to a potential consolidation phase before any significant price movement. Traders should exercise caution and wait for clearer signals before making any trading decisions.