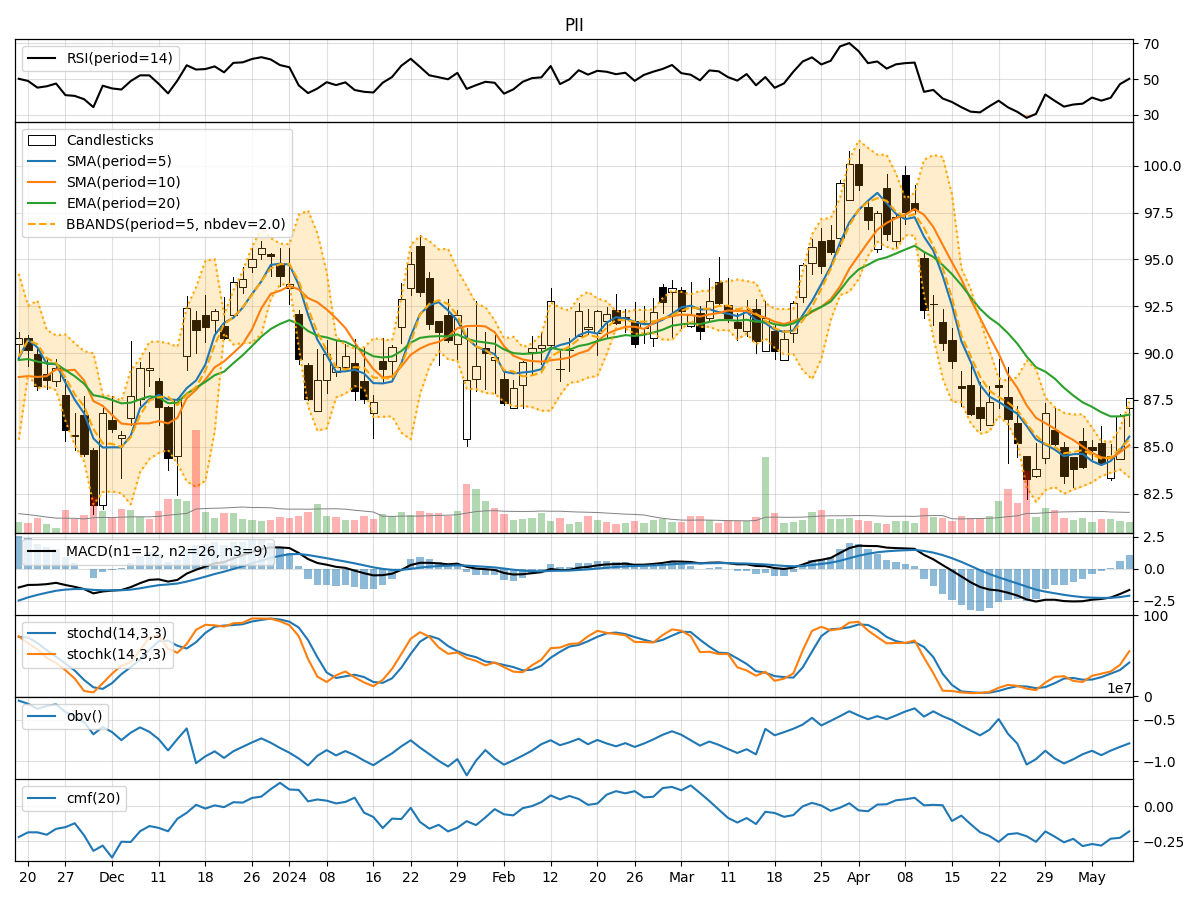
Technical Analysis of PII 2024-05-10
Overview:
In analyzing the technical indicators for PII stock over the last 5 days, we will delve into the trend, momentum, volatility, and volume indicators to provide a comprehensive outlook on the possible future stock price movement. By examining these key indicators, we aim to offer valuable insights and predictions for the upcoming trading days.
Trend Analysis:
- Moving Averages (MA): The 5-day Moving Average (MA) has been fluctuating around the closing prices, indicating short-term price trends. The Simple Moving Average (SMA) and Exponential Moving Average (EMA) show a downward trend, suggesting a bearish sentiment.
- MACD: The Moving Average Convergence Divergence (MACD) has been negative, with the MACD line consistently below the signal line. This indicates a bearish momentum in the stock price.
- Conclusion: The trend indicators suggest a bearish outlook for PII stock in the short term.
Momentum Analysis:
- RSI: The Relative Strength Index (RSI) has been below 50, indicating a bearish momentum in the stock.
- Stochastic Oscillator: Both %K and %D have been trending downwards, suggesting a weakening momentum.
- Conclusion: The momentum indicators align with the trend indicators, indicating a bearish sentiment for PII stock.
Volatility Analysis:
- Bollinger Bands (BB): The Bollinger Bands have been widening, indicating increased volatility in the stock price.
- Conclusion: The volatility indicators suggest that PII stock is experiencing increased price fluctuations, which may lead to unpredictable movements in the near future.
Volume Analysis:
- On-Balance Volume (OBV): The OBV has been fluctuating, indicating mixed buying and selling pressure.
- Chaikin Money Flow (CMF): The CMF has been negative, suggesting a bearish money flow trend.
- Conclusion: The volume indicators show a lack of strong buying interest, supporting the bearish outlook for PII stock.
Overall Conclusion:
Based on the analysis of trend, momentum, volatility, and volume indicators, the overall outlook for PII stock in the next few days is bearish. The technical indicators collectively point towards a continued downward trend with increased volatility and weak buying pressure. Traders and investors should exercise caution and consider shorting or staying away from long positions until a reversal in the indicators is observed.
Key Recommendations:
- Short-Term Traders: Consider shorting PII stock or adopting a bearish strategy to capitalize on the expected downward movement.
- Long-Term Investors: Exercise patience and wait for more favorable technical signals before considering entry or accumulation.
- Risk Management: Implement strict stop-loss orders to mitigate potential losses in case of adverse price movements.
In conclusion, the technical analysis indicates a bearish stance for PII stock in the upcoming trading days. It is crucial to monitor the indicators closely for any signs of a trend reversal before considering a change in trading strategy.