Technical Analysis of PPG 2024-05-10
Overview:
In analyzing the technical indicators for PPG stock over the last 5 days, we will delve into the trend, momentum, volatility, and volume indicators to provide a comprehensive outlook on the possible stock price movement in the coming days. By examining these key indicators, we aim to offer valuable insights and predictions for informed decision-making.
Trend Analysis:
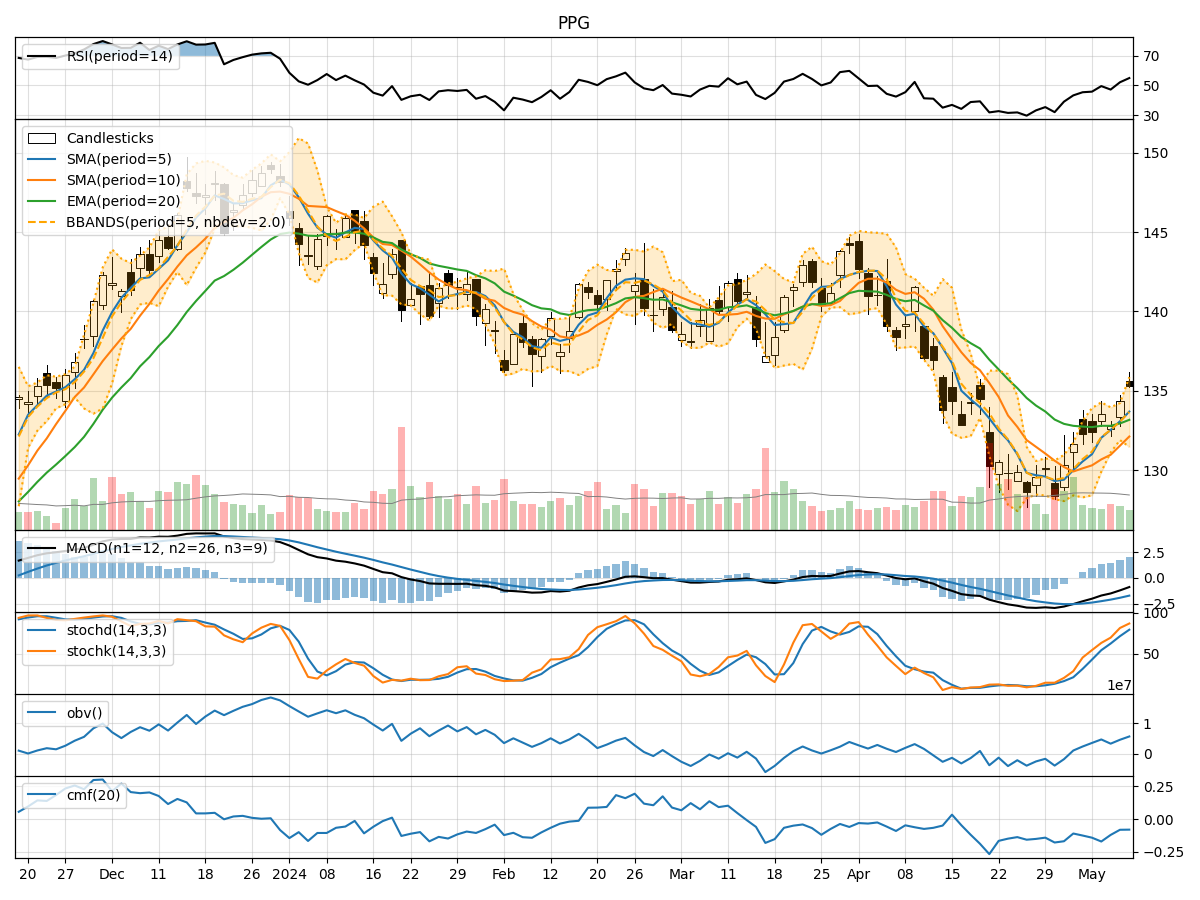
- Moving Averages (MA): The 5-day Moving Average (MA) has been consistently trending upwards, indicating a positive momentum in the stock price.
- MACD: The Moving Average Convergence Divergence (MACD) has shown an increasing trend, with the MACD line consistently above the signal line, suggesting a bullish momentum.
- EMA: The Exponential Moving Average (EMA) has been on an upward trajectory, further supporting the bullish sentiment in the stock.
Momentum Analysis:
- RSI: The Relative Strength Index (RSI) has been gradually increasing, indicating strengthening buying pressure in the stock.
- Stochastic Oscillator: Both %K and %D lines of the Stochastic Oscillator have been rising, signaling an uptrend in the stock momentum.
- Williams %R: The Williams %R indicator has been fluctuating but generally moving towards oversold territory, suggesting a potential buying opportunity.
Volatility Analysis:
- Bollinger Bands: The Bollinger Bands have been widening, indicating increased volatility in the stock price.
- Bollinger %B: The %B indicator has been fluctuating within the bands, reflecting the volatility but not providing a clear directional bias.
Volume Analysis:
- On-Balance Volume (OBV): The OBV indicator has shown mixed signals, with fluctuations in volume accumulation.
- Chaikin Money Flow (CMF): The CMF has been negative, indicating a slight outflow of money from the stock.
Key Observations:
- The trend indicators suggest a bullish sentiment with positive moving averages and MACD.
- Momentum indicators point towards a strengthening buying pressure with rising RSI and Stochastic Oscillator.
- Volatility has increased, as seen in the widening Bollinger Bands, indicating potential price fluctuations.
- Volume indicators show mixed signals, with OBV fluctuating and CMF slightly negative.
Conclusion:
Based on the analysis of the technical indicators, the overall outlook for PPG stock in the next few days is bullish. The positive trend and momentum indicators, coupled with increased volatility, suggest potential upward movement in the stock price. However, it is essential to monitor the volume indicators closely for confirmation of the bullish trend. Traders and investors may consider taking long positions in PPG stock based on the current technical analysis.