Technical Analysis of PRA 2024-05-10
Overview:
In analyzing the technical indicators for PRA stock over the last 5 days, we will delve into the trend, momentum, volatility, and volume indicators to provide a comprehensive outlook on the possible stock price movement in the coming days. By examining these key indicators, we aim to offer valuable insights and predictions for potential investors.
Trend Analysis:
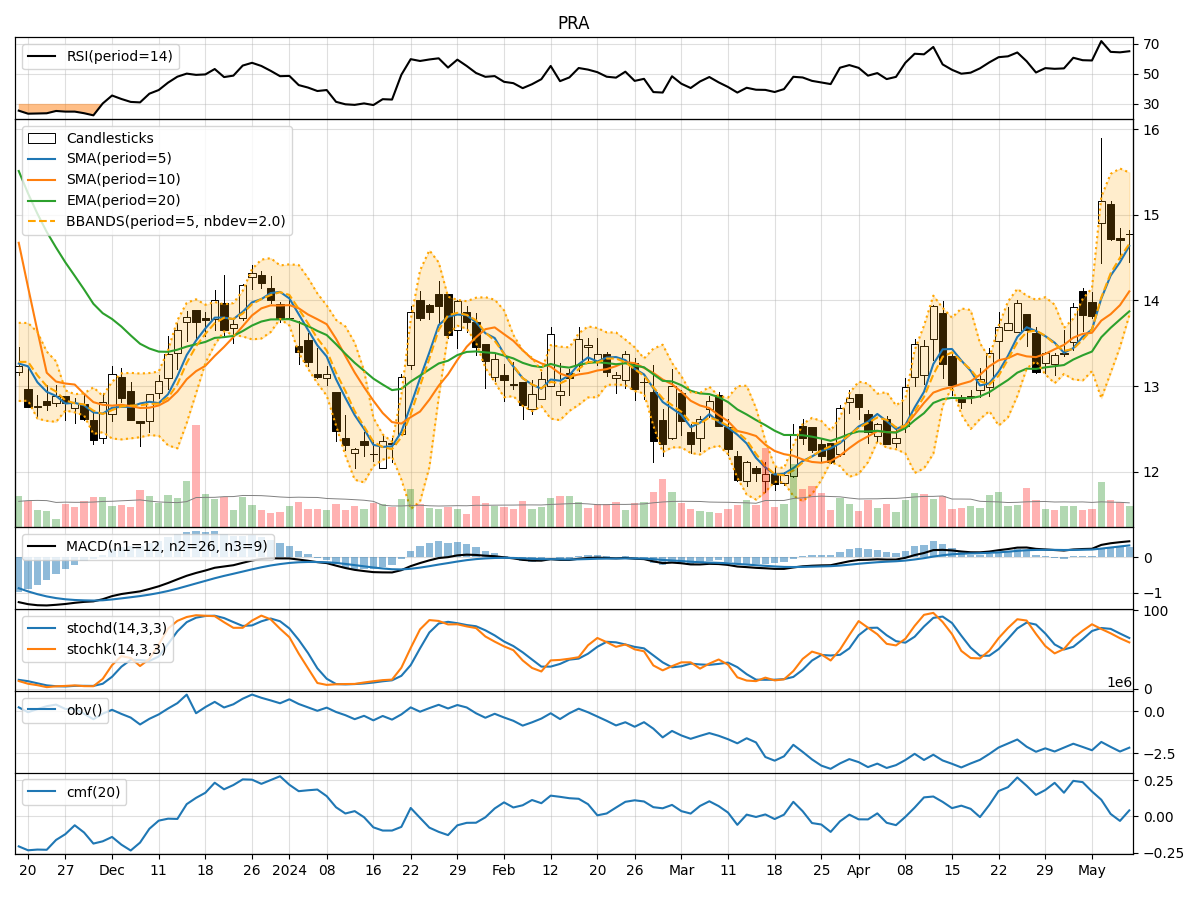
- Moving Averages (MA): The 5-day Moving Average (MA) has been consistently above the closing prices, indicating an upward trend in the short term.
- MACD: The MACD line has been above the signal line for the past 5 days, with both lines showing an upward trajectory, suggesting bullish momentum.
Momentum Analysis:
- RSI: The Relative Strength Index (RSI) has been fluctuating around the 60-70 range, indicating neutral momentum without being overbought or oversold.
- Stochastic Oscillator: Both %K and %D lines have been gradually decreasing, signaling a weakening momentum in the short term.
Volatility Analysis:
- Bollinger Bands (BB): The Bollinger Bands have been relatively narrow, indicating low volatility in the stock price movement.
Volume Analysis:
- On-Balance Volume (OBV): The OBV has been negative for the past 5 days, suggesting selling pressure in the stock.
- Chaikin Money Flow (CMF): The CMF has been positive but decreasing, indicating weakening buying pressure.
Key Observations:
- The trend indicators suggest a bullish bias in the short term, supported by the moving averages and MACD.
- Momentum indicators show a neutral to slightly bearish sentiment, with the RSI hovering in the neutral zone and stochastic oscillator pointing towards weakening momentum.
- Volatility remains low, indicating a lack of significant price fluctuations.
- Volume indicators reflect selling pressure as seen in the negative OBV, although the CMF suggests some buying interest.
Conclusion:
Based on the analysis of the technical indicators, the next few days' possible stock price movement for PRA is likely to be sideways with a slight bearish bias. While the trend indicators point towards a bullish outlook, the weakening momentum and selling pressure indicated by the volume indicators may lead to a consolidation phase or a minor pullback in the stock price. Investors should closely monitor key support and resistance levels for potential entry or exit points in line with the current market dynamics.