Technical Analysis of PRI 2024-05-10
Overview:
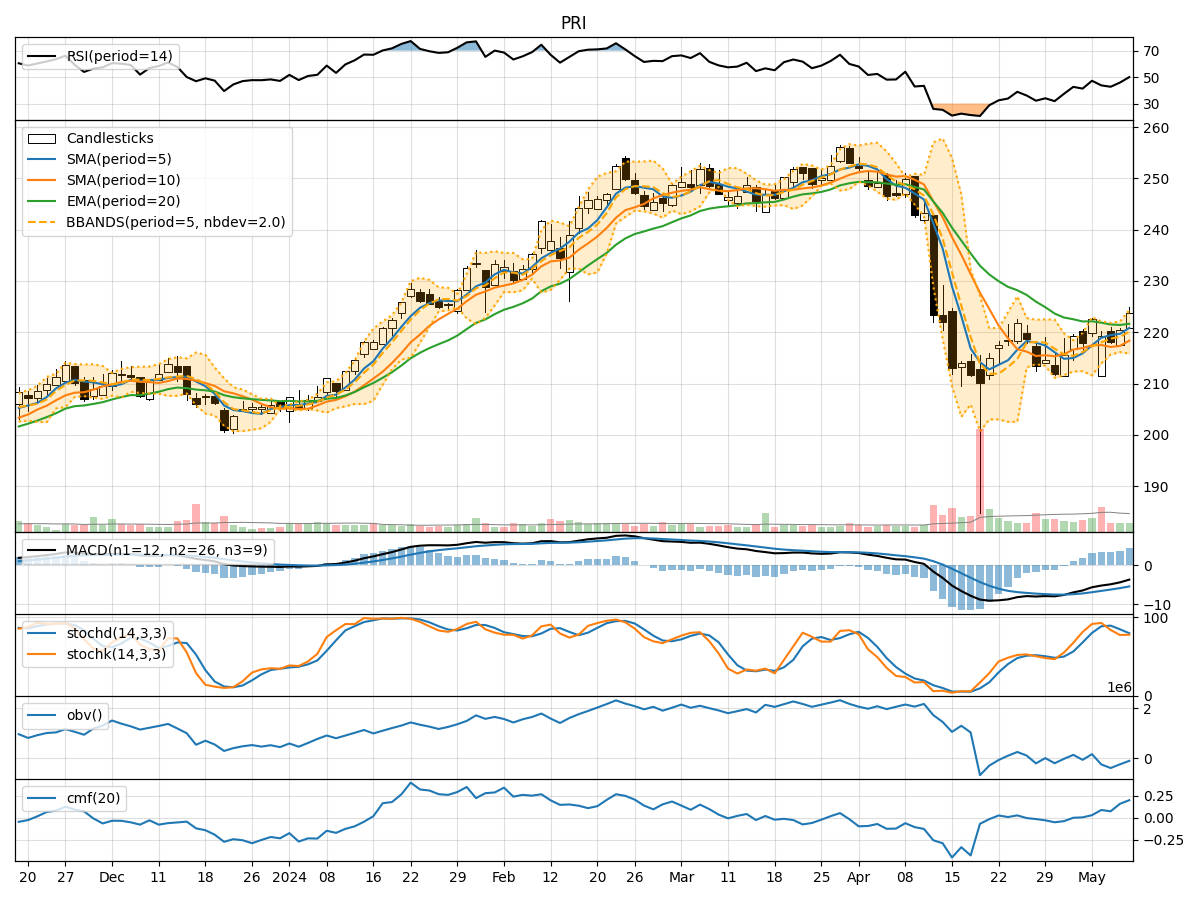
In analyzing the technical indicators for PRI stock over the last 5 days, we will delve into the trend, momentum, volatility, and volume indicators to provide a comprehensive outlook on the possible stock price movement in the coming days.
Trend Analysis:
- Moving Averages (MA): The 5-day Moving Average (MA) has been consistently rising, indicating a bullish trend in the short term.
- MACD: The Moving Average Convergence Divergence (MACD) has shown positive values, suggesting upward momentum in the stock price.
- EMA: The Exponential Moving Average (EMA) has been relatively stable, reflecting a steady trend.
Momentum Analysis:
- RSI: The Relative Strength Index (RSI) has been fluctuating around the midline, indicating indecision in the market.
- Stochastic Oscillator: Both %K and %D have been oscillating, signaling potential reversal points.
- Williams %R: The Williams %R has been hovering near oversold levels, suggesting a possible buying opportunity.
Volatility Analysis:
- Bollinger Bands: The Bollinger Bands have been narrowing, indicating decreasing volatility and a potential breakout in the near future.
Volume Analysis:
- On-Balance Volume (OBV): The OBV has been declining, suggesting selling pressure in the stock.
- Chaikin Money Flow (CMF): The CMF has been positive, indicating buying pressure despite the declining OBV.
Key Observations:
- The trend indicators suggest a bullish bias in the short term.
- Momentum indicators show mixed signals with a slight bearish bias.
- Volatility is contracting, hinting at a potential price breakout.
- Volume indicators reflect a divergence between OBV and CMF, indicating conflicting market sentiment.
Conclusion:
Based on the analysis of the technical indicators, the stock price of PRI is likely to experience a short-term upward movement due to the bullish trend indicated by moving averages and MACD. However, the mixed signals from momentum indicators and the divergence in volume indicators suggest a potential consolidation phase or a minor pullback before resuming the uptrend. Traders should closely monitor key support and resistance levels for confirmation of the price direction.
Recommendation:
- Short-term Traders: Consider taking long positions with tight stop-loss levels to capitalize on the potential upward movement.
- Long-term Investors: Monitor the price action for a clearer trend confirmation before making significant investment decisions.
Disclaimer:
Remember that technical analysis is not foolproof and should be used in conjunction with other forms of analysis. Market conditions can change rapidly, so it's essential to stay informed and adapt your strategies accordingly.