Technical Analysis of PRMW 2024-05-10
Overview:
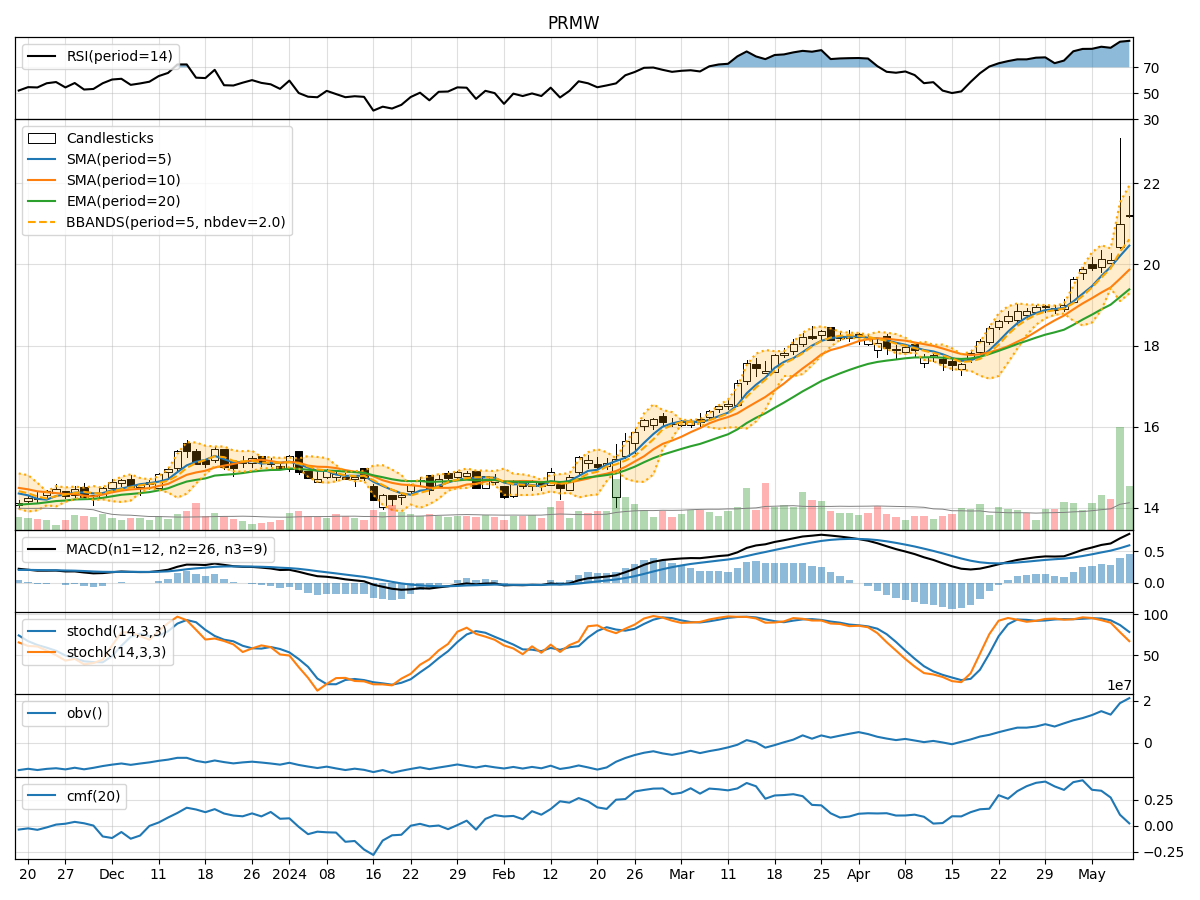
In analyzing the technical indicators for PRMW over the last 5 days, we will delve into the trend, momentum, volatility, and volume indicators to provide a comprehensive outlook on the possible stock price movement in the coming days.
Trend Analysis:
- Moving Averages (MA): The 5-day Moving Average has been consistently rising, indicating a bullish trend.
- MACD: The MACD line has been above the signal line, suggesting a bullish momentum.
- EMA: The Exponential Moving Average has been trending upwards, supporting the bullish sentiment.
Momentum Analysis:
- RSI: The Relative Strength Index has been in the overbought territory, signaling a strong bullish momentum.
- Stochastic Oscillator: Both %K and %D have been declining but remain in the overbought zone, indicating a potential reversal.
- Williams %R: The indicator has been in the oversold region, suggesting a possible reversal to the upside.
Volatility Analysis:
- Bollinger Bands: The stock price has been trading above the upper Bollinger Band, indicating overbought conditions.
- Bollinger %B: The %B indicator has been above 0.8, signaling a potential pullback in price.
- Average True Range (ATR): The ATR has shown an increase in volatility over the last few days.
Volume Analysis:
- On-Balance Volume (OBV): The OBV has been trending upwards, indicating accumulation by investors.
- Chaikin Money Flow (CMF): The CMF has been positive but declining, suggesting a potential decrease in buying pressure.
Key Observations:
- The stock is currently in a strong bullish trend based on moving averages and MACD.
- Momentum indicators like RSI and Stochastic Oscillator suggest a potential reversal or consolidation in the short term.
- Volatility has increased, indicating potential price swings.
- Volume indicators show accumulation but a slight decrease in buying pressure.
Conclusion:
Based on the analysis of technical indicators, the stock is likely to experience a short-term pullback or consolidation after the recent bullish run. Traders should be cautious of overbought conditions and monitor key support levels for potential entry points. A correction or sideways movement is expected in the next few days, followed by a potential resumption of the uptrend if key support levels hold. It is advisable to wait for confirmation signals before making any trading decisions.