Technical Analysis of PSQH 2024-05-31
Overview:
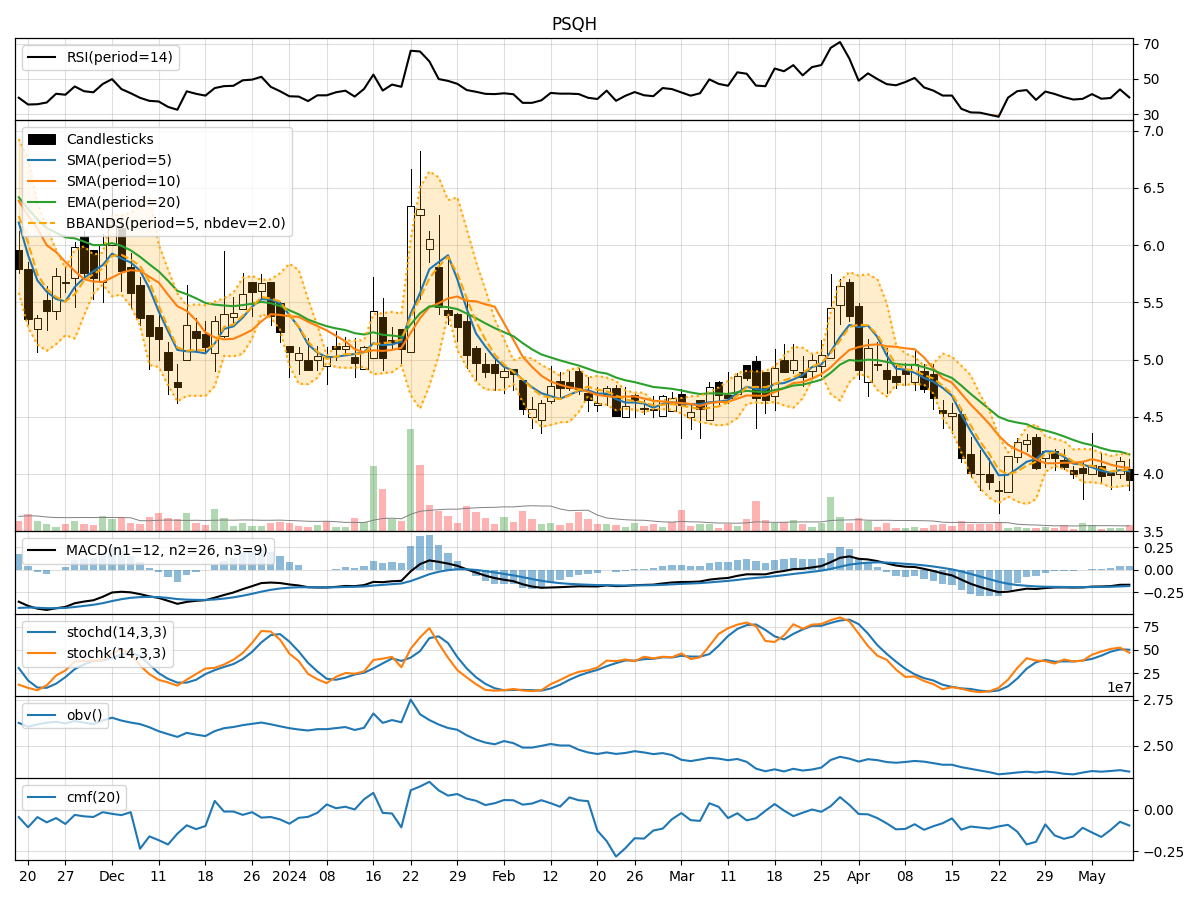
In analyzing the technical indicators for PSQH over the last 5 days, we will delve into the trend, momentum, volatility, and volume indicators to provide a comprehensive outlook on the possible stock price movement in the coming days.
Trend Analysis:
- Moving Averages (MA): The 5-day MA has been consistently below the closing price, indicating a short-term downtrend.
- MACD: The MACD line has been decreasing, with the MACD histogram also showing a downward trend, suggesting bearish momentum.
Momentum Analysis:
- RSI: The RSI has been fluctuating in the oversold region, indicating a bearish sentiment.
- Stochastic Oscillator: Both %K and %D have been declining, signaling a bearish momentum.
Volatility Analysis:
- Bollinger Bands (BB): The stock price has been trading below the middle Bollinger Band, indicating a bearish trend.
Volume Analysis:
- On-Balance Volume (OBV): The OBV has been decreasing, suggesting selling pressure.
- Chaikin Money Flow (CMF): The CMF has been negative, indicating a bearish money flow.
Key Observations:
- The stock is currently in a downtrend based on moving averages and MACD.
- Momentum indicators like RSI and Stochastic Oscillator suggest bearish sentiment.
- Volatility indicators show a bearish trend with the stock trading below the middle Bollinger Band.
- Volume indicators reflect selling pressure with negative OBV and CMF.
Conclusion:
Based on the analysis of technical indicators, the next few days are likely to see a continuation of the bearish trend for PSQH. The stock is expected to face further downward pressure, with a high probability of declining prices in the near term. Traders and investors should exercise caution and consider shorting or staying away from long positions until there are clear signs of a trend reversal.