Technical Analysis of PSTG 2024-05-10
Overview:
In analyzing the technical indicators for PSTG over the last 5 days, we will delve into the trend, momentum, volatility, and volume indicators to provide a comprehensive outlook on the possible stock price movement in the coming days. By examining these key aspects, we aim to offer valuable insights and predictions for potential investors.
Trend Analysis:
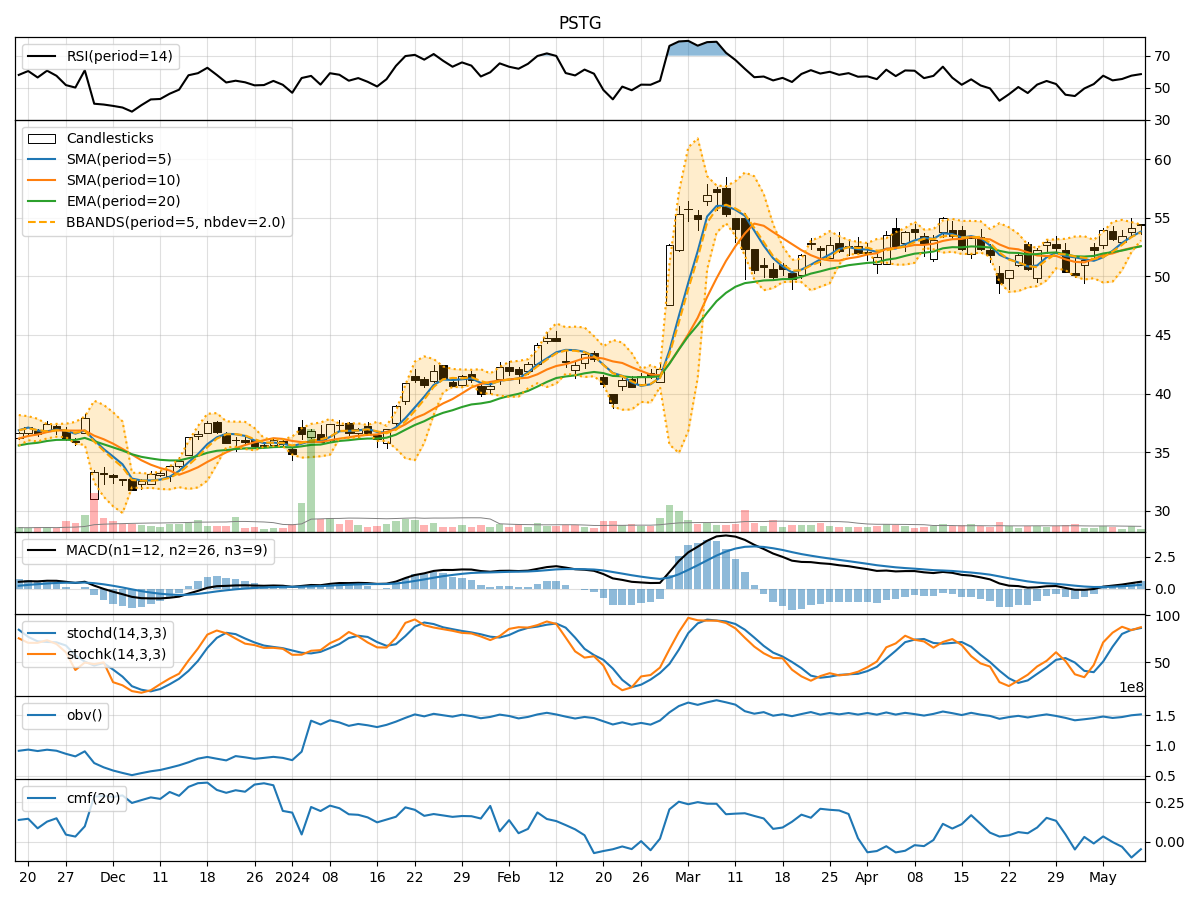
- Moving Averages (MA): The 5-day Moving Average (MA) has been consistently above the Simple Moving Average (SMA) and Exponential Moving Average (EMA), indicating a bullish trend.
- MACD: The MACD line has been consistently above the signal line, with both lines showing an upward trend, suggesting bullish momentum.
- Conclusion: The trend indicators point towards an upward trend in the stock price.
Momentum Analysis:
- RSI: The Relative Strength Index (RSI) has been fluctuating but generally staying above 50, indicating bullish momentum.
- Stochastic Oscillator: Both %K and %D have been in the overbought zone, suggesting a strong bullish momentum.
- Conclusion: Momentum indicators signal a bullish sentiment in the stock.
Volatility Analysis:
- Bollinger Bands (BB): The stock price has been consistently trading above the middle Bollinger Band, indicating an upward trend with low volatility.
- Conclusion: Volatility indicators suggest a stable price movement with a slight upward bias.
Volume Analysis:
- On-Balance Volume (OBV): The OBV has been increasing over the last few days, indicating accumulation by investors.
- Chaikin Money Flow (CMF): The CMF has been negative but improving, suggesting a potential reversal in buying pressure.
- Conclusion: Volume indicators hint at accumulation and a potential reversal in buying pressure.
Conclusion:
Based on the analysis of trend, momentum, volatility, and volume indicators, the overall outlook for PSTG is bullish. The stock is likely to experience an upward price movement in the coming days. Investors may consider entering long positions or holding onto existing positions to capitalize on the expected price appreciation.
Key Takeaways:
- Bullish Trend: The stock is in an upward trend based on moving averages and MACD.
- Strong Momentum: Momentum indicators suggest a strong bullish sentiment.
- Stable Volatility: Volatility indicators point towards stable price movement.
- Accumulation: Volume indicators indicate accumulation and a potential buying pressure reversal.
Recommendation:
Considering the bullish outlook and positive momentum, investors may look for opportunities to enter long positions in PSTG. It is advisable to closely monitor the price action and key technical levels to capitalize on potential gains in the stock.
Disclaimer:
While technical analysis provides valuable insights, it is essential to consider other fundamental factors and market dynamics before making investment decisions. It is recommended to conduct thorough research and consult with a financial advisor to align investments with individual financial goals and risk tolerance levels.