Technical Analysis of PVH 2024-05-10
Overview:
In analyzing the technical indicators for PVH over the last 5 days, we will delve into the trend, momentum, volatility, and volume indicators to provide a comprehensive outlook on the possible stock price movement in the coming days. By examining these key aspects, we aim to offer valuable insights and predictions for potential investors.
Trend Analysis:
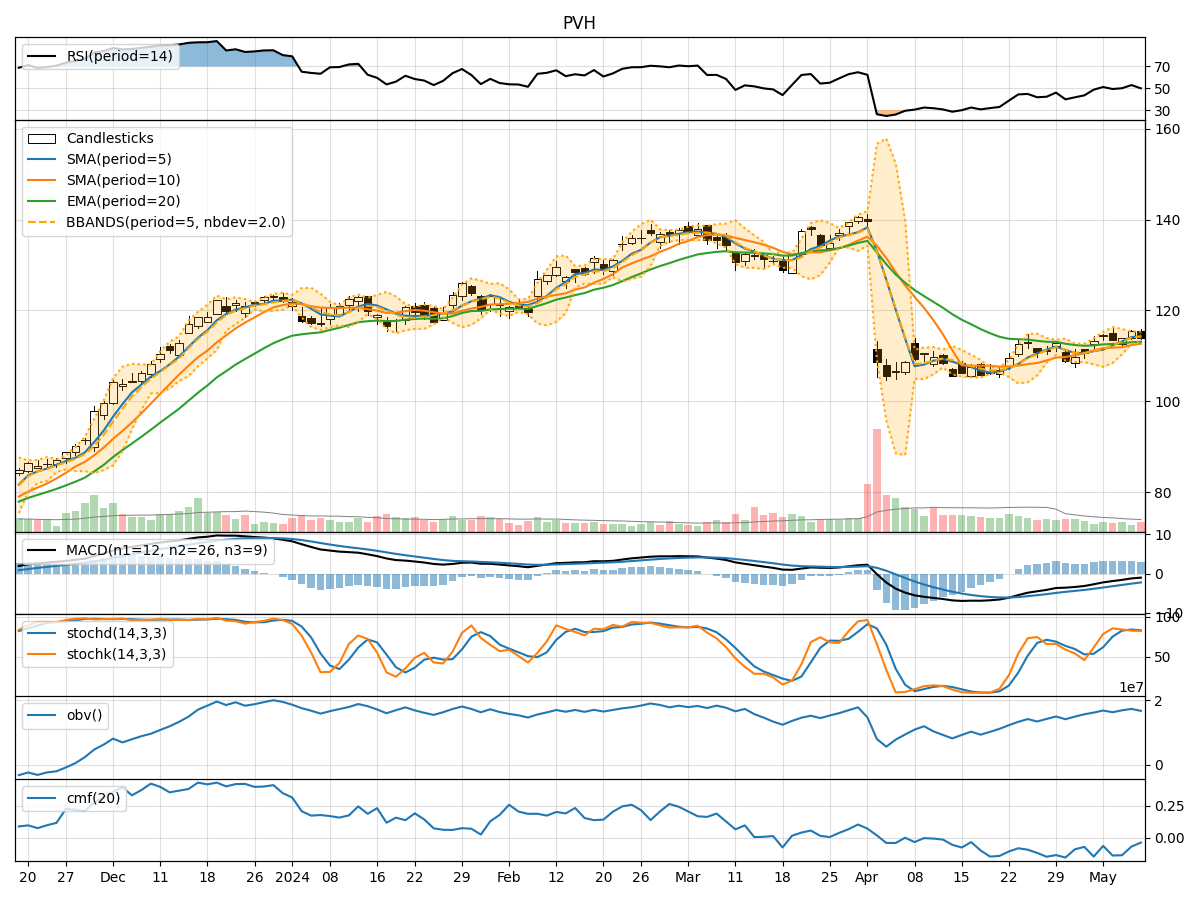
- Moving Averages (MA): The 5-day Moving Average (MA) has been consistently above the Simple Moving Average (SMA) and Exponential Moving Average (EMA), indicating a bullish trend.
- MACD: The MACD line has been negative but showing signs of convergence towards the signal line, suggesting a potential reversal in the bearish momentum.
Momentum Analysis:
- RSI: The Relative Strength Index (RSI) has been fluctuating around the neutral zone, indicating indecision in the market.
- Stochastic Oscillator: Both %K and %D have been hovering in the overbought territory, signaling a potential reversal or consolidation.
Volatility Analysis:
- Bollinger Bands (BB): The stock price has been trading within the Bollinger Bands, with the bands narrowing, indicating decreasing volatility.
- Bollinger %B: The %B indicator has been fluctuating around the midline, suggesting a lack of clear direction in price movement.
Volume Analysis:
- On-Balance Volume (OBV): The OBV has been fluctuating, indicating mixed buying and selling pressure.
- Chaikin Money Flow (CMF): The CMF has been negative, suggesting outflow of money from the stock.
Conclusion:
Based on the analysis of the technical indicators, the stock of PVH is currently in a sideways consolidation phase with mixed signals across different indicators. The trend is slightly bullish, supported by the moving averages, while momentum and volume indicators show indecision and lack of strong buying pressure. The volatility is decreasing, indicating a potential period of stability.
Forecast:
Given the current market dynamics and the mixed signals from the technical indicators, it is likely that PVH stock will continue to trade in a sideways pattern in the next few days. Traders should exercise caution and wait for clearer signals before making significant trading decisions. It is advisable to closely monitor key levels and wait for a breakout or breakdown from the consolidation phase to determine the next major price direction.
Disclaimer:
Remember that technical analysis is not a guaranteed predictor of future price movements, and other fundamental factors can influence stock prices. It is essential to conduct thorough research and consider multiple indicators before making any investment decisions. Consulting with a financial advisor is recommended for personalized investment advice tailored to your specific financial goals and risk tolerance.