Technical Analysis of PWR 2024-05-10
Overview:
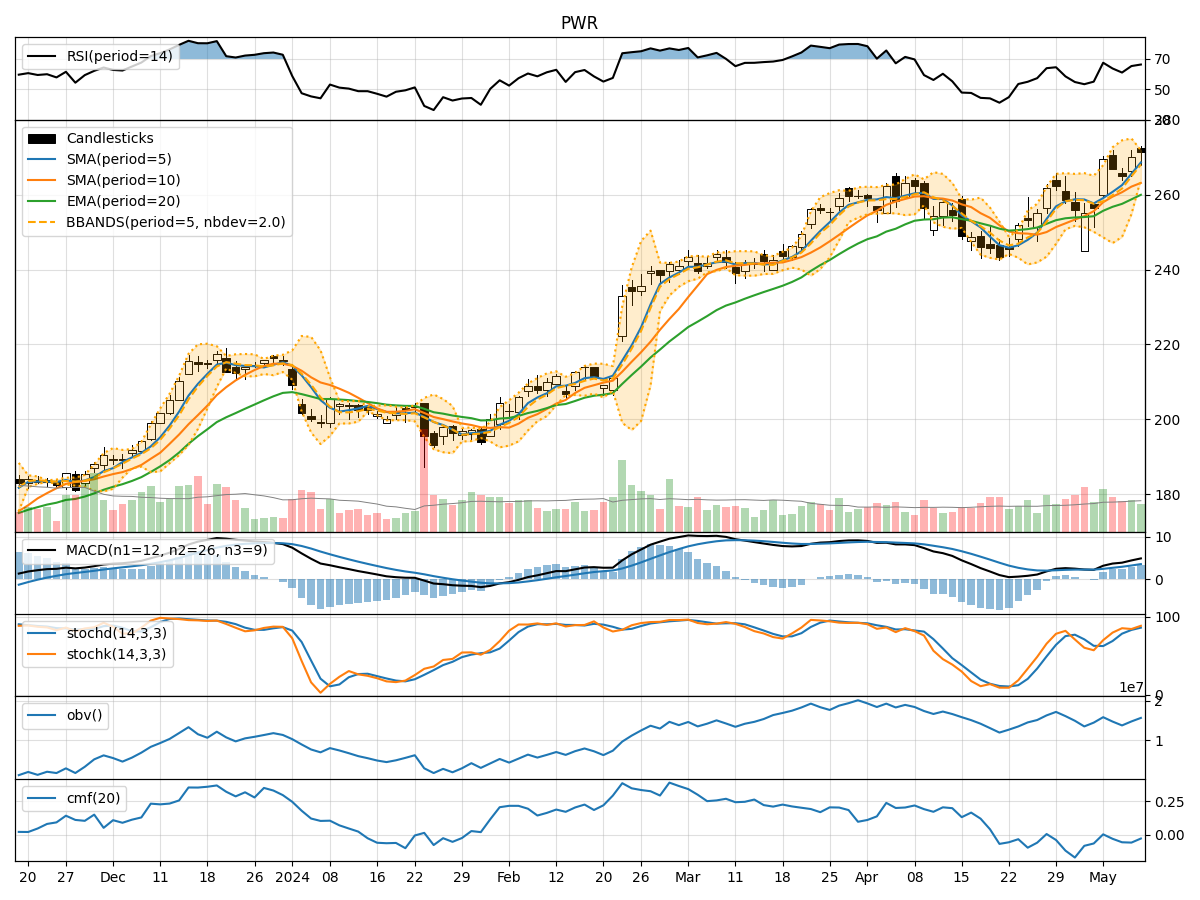
In analyzing the technical indicators for PWR over the last 5 days, we will delve into the trend, momentum, volatility, and volume indicators to provide a comprehensive outlook on the possible stock price movement in the coming days.
Trend Analysis:
- Moving Averages (MA): The 5-day MA has been consistently rising, indicating a bullish trend.
- MACD: The MACD line has been above the signal line, suggesting a bullish momentum.
- EMA: The EMA has been trending upwards, supporting the bullish sentiment.
Momentum Analysis:
- RSI: The RSI has been in the overbought territory, indicating a strong bullish momentum.
- Stochastic Oscillator: Both %K and %D have been in the overbought zone, signaling a potential reversal.
- Williams %R: The indicator has been in the oversold region, suggesting a possible bullish reversal.
Volatility Analysis:
- Bollinger Bands: The bands have been widening, indicating increased volatility.
- Bollinger %B: The %B has been fluctuating, reflecting the volatile price movements.
Volume Analysis:
- On-Balance Volume (OBV): The OBV has shown mixed signals, suggesting indecision among market participants.
- Chaikin Money Flow (CMF): The CMF has been negative, indicating selling pressure.
Key Observations:
- The trend indicators suggest a strong bullish sentiment in the short term.
- Momentum indicators show conflicting signals with overbought conditions, hinting at a potential reversal.
- Volatility has increased, leading to wider price fluctuations.
- Volume indicators reflect uncertainty in market participation.
Conclusion:
Based on the analysis of technical indicators, the stock price of PWR is likely to experience further upward movement in the next few days. The bullish trend supported by moving averages and MACD signals a positive outlook. However, caution is advised due to the overbought conditions in momentum indicators and increased volatility. Traders should closely monitor price action for potential signs of a reversal, especially if the stochastic oscillator and Williams %R indicators start to show bearish divergences.