Technical Analysis of PXD 2024-04-26
Overview:
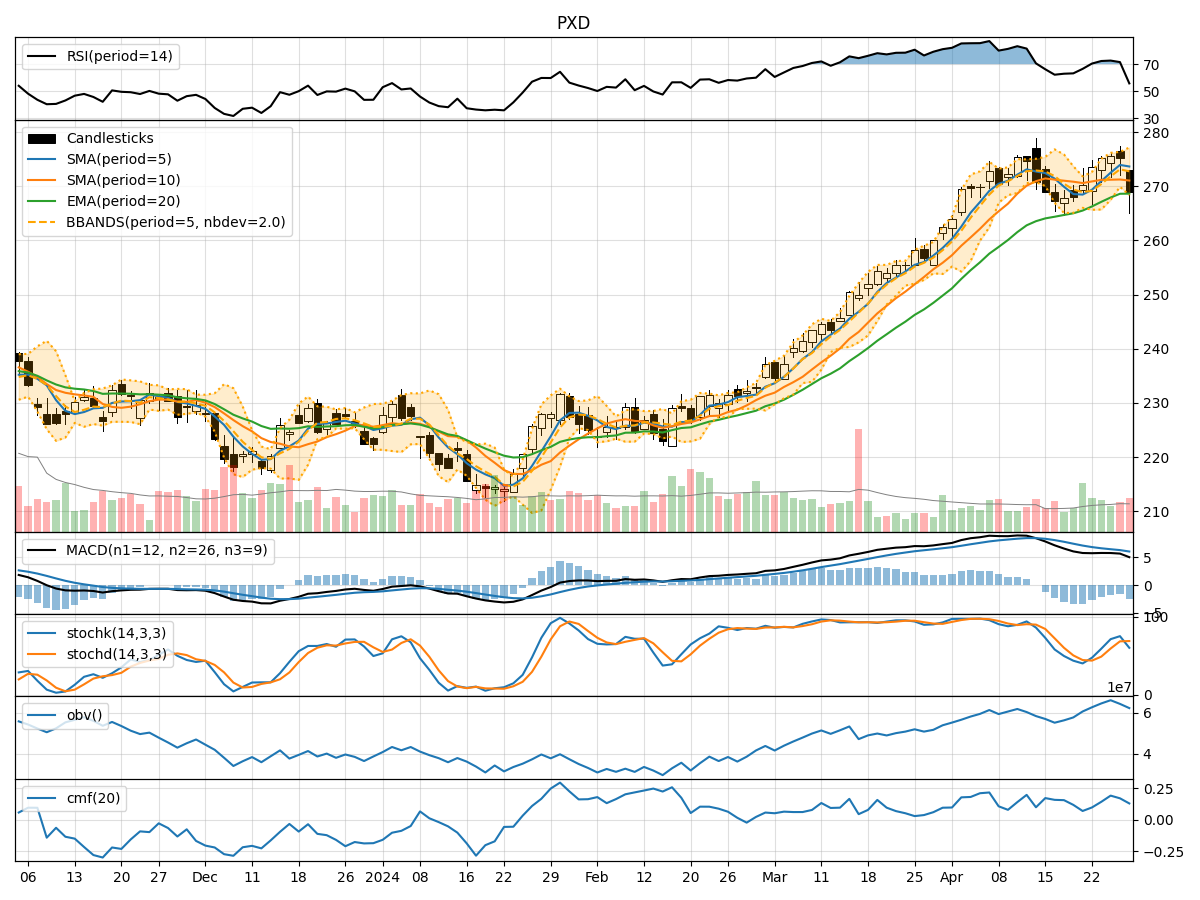
In the last 5 trading days, PXD stock has shown mixed signals across various technical indicators. The stock price has fluctuated within a range, with some indicators suggesting potential bullish momentum while others indicating a possible consolidation or bearish trend. Let's delve deeper into each category of technical indicators to provide a comprehensive analysis and make a prediction for the next few days.
Trend Indicators:
- Moving Averages (MA): The 5-day Moving Average (MA) has been above the Simple Moving Average (SMA) and Exponential Moving Average (EMA), indicating a short-term bullish trend.
- MACD: The MACD line has been fluctuating around the signal line, suggesting indecision in the market momentum.
- MACD Histogram: The MACD Histogram has shown a slight decrease, indicating a potential weakening of bullish momentum.
Momentum Indicators:
- RSI: The Relative Strength Index (RSI) has been fluctuating in the overbought territory, indicating a strong bullish momentum.
- Stochastic Oscillator: The Stochastic Oscillator has been in the overbought zone, suggesting a potential reversal or consolidation.
- Williams %R: The Williams %R is in the oversold territory, indicating a possible bearish reversal.
Volatility Indicators:
- Bollinger Bands: The Bollinger Bands have shown a narrowing of the bands, indicating decreasing volatility and a potential price breakout.
- Bollinger %B: The %B indicator is close to 0, suggesting the stock price is near the lower band, potentially indicating a buying opportunity.
Volume Indicators:
- On-Balance Volume (OBV): The OBV has shown mixed signals, with fluctuations in volume accumulation.
- Chaikin Money Flow (CMF): The CMF has been positive, indicating buying pressure in the market.
Key Observations and Opinions:
- Trend: The trend indicators suggest a short-term bullish bias, supported by the moving averages. However, the MACD histogram indicates a potential weakening of bullish momentum.
- Momentum: The momentum indicators show conflicting signals, with RSI indicating strong bullish momentum while Stochastic and Williams %R suggest a possible reversal or consolidation.
- Volatility: The narrowing Bollinger Bands and %B indicator near 0 indicate a potential breakout, but the overall volatility is decreasing.
- Volume: The volume indicators show mixed signals, with no clear trend in volume accumulation.
Conclusion:
Based on the analysis of the technical indicators, the next few days for PXD stock could see sideways consolidation with a slight bullish bias. Traders should closely monitor the price action around the key support and resistance levels for potential breakout opportunities. It is essential to wait for confirmation from multiple indicators before making any trading decisions.