Technical Analysis of RBA 2024-05-10
Overview:
In analyzing the technical indicators for the stock based on the last 5 days of data, we will delve into the trend, momentum, volatility, and volume indicators to provide a comprehensive outlook on the possible stock price movement in the coming days. By examining these key indicators, we aim to offer valuable insights and predictions for informed decision-making.
Trend Indicators:
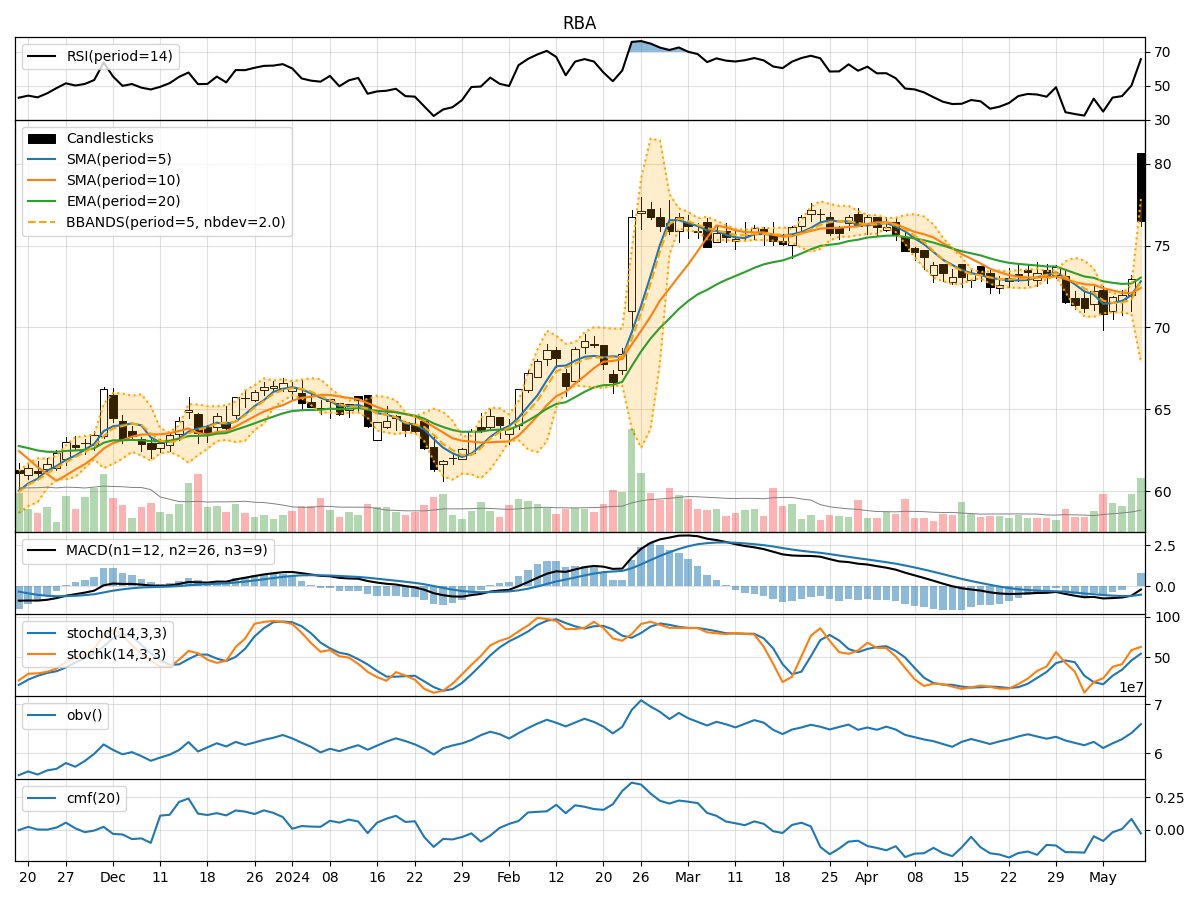
- Moving Averages (MA): The 5-day Moving Average (MA) has been fluctuating around the closing prices, indicating short-term price trends. The Simple Moving Average (SMA) and Exponential Moving Average (EMA) show a slight downward trend, with the EMA lagging behind.
- Moving Average Convergence Divergence (MACD): The MACD line has been negative, indicating a bearish trend, although the MACD Histogram has shown signs of improvement in the last day.
Momentum Indicators:
- Relative Strength Index (RSI): The RSI has been gradually increasing, suggesting strengthening momentum in the stock price.
- Stochastic Oscillator: Both %K and %D lines of the Stochastic Oscillator have been rising, indicating increasing buying pressure.
- Williams %R (Willams %R): The Williams %R has been moving towards oversold territory, potentially signaling a reversal in the stock price.
Volatility Indicators:
- Bollinger Bands (BB): The Bollinger Bands have widened significantly, indicating increased volatility in the stock price. The current price is near the upper band, suggesting a potential overbought condition.
- Bollinger Percent (BBP): The Bollinger Percent has been increasing, reflecting the recent price surge and potential for a pullback.
Volume Indicators:
- On-Balance Volume (OBV): The OBV has shown mixed signals, with some days experiencing selling pressure and others showing accumulation. The recent uptick in OBV suggests renewed buying interest.
- Chaikin Money Flow (CMF): The CMF has been negative but has shown a slight improvement, indicating a potential shift towards buying pressure.
Key Observations:
- The stock has experienced a significant price increase over the last 5 days, supported by improving momentum indicators and increasing buying pressure.
- Volatility has surged, potentially leading to a period of consolidation or a pullback in the stock price.
- The trend indicators show a mixed picture, with the MACD signaling a bearish trend while the moving averages suggest a potential reversal.
Conclusion:
Based on the analysis of the technical indicators, the stock is likely to experience a short-term pullback or consolidation in the coming days. While momentum and buying pressure have been increasing, the overbought conditions indicated by the Bollinger Bands and the potential reversal signals from the trend indicators suggest a period of sideways movement or a slight downward correction. Traders should exercise caution and consider taking profits or implementing risk management strategies in anticipation of a potential price retracement.