Technical Analysis of RBC 2024-05-10
Overview:
In analyzing the technical indicators for RBC over the last 5 days, we will delve into the trend, momentum, volatility, and volume indicators to provide a comprehensive outlook on the possible stock price movement in the coming days. By examining these key aspects, we aim to offer valuable insights and predictions to guide investment decisions.
Trend Analysis:
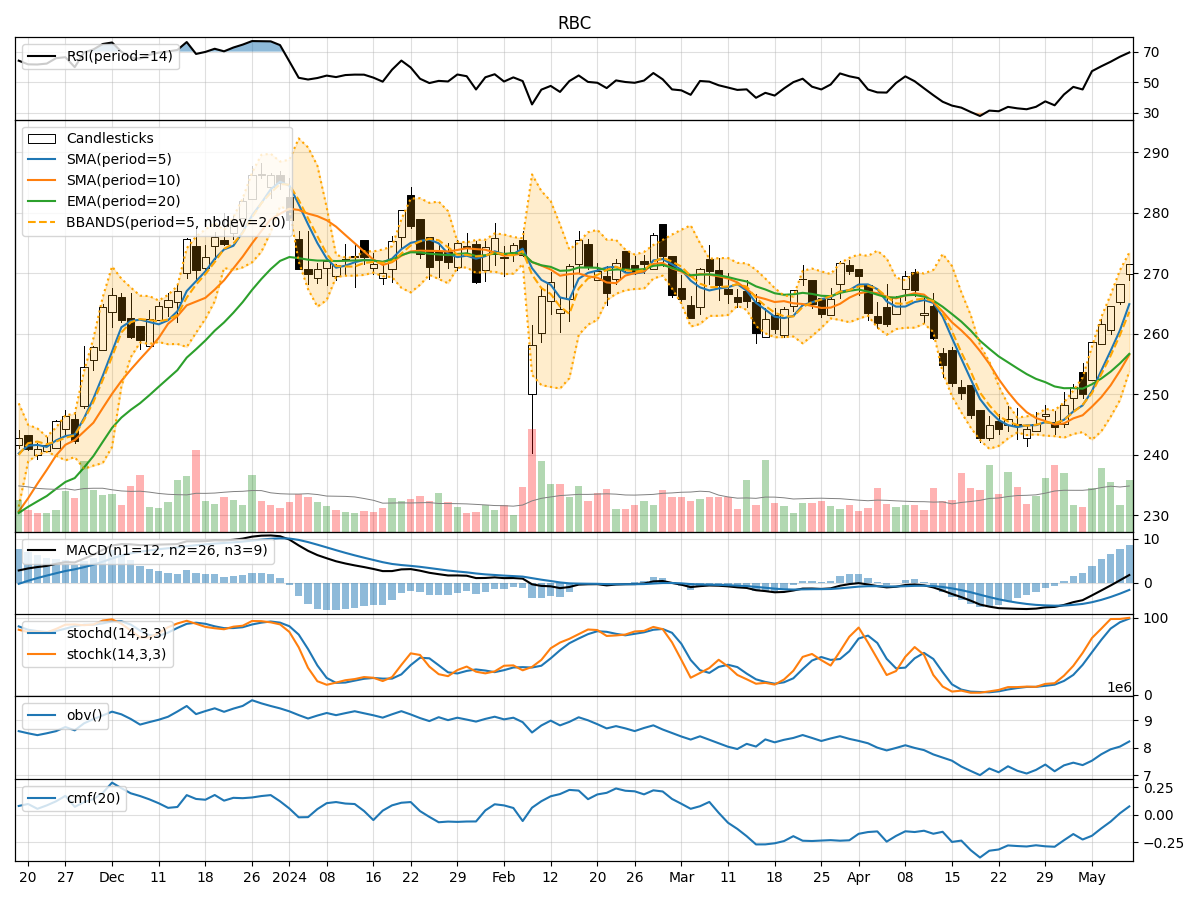
- Moving Averages (MA): The 5-day Moving Average (MA) has been consistently rising, indicating an upward trend in the stock price.
- MACD: The Moving Average Convergence Divergence (MACD) has shown positive values, suggesting bullish momentum.
- EMA: The Exponential Moving Average (EMA) has also been trending upwards, supporting the bullish sentiment.
Momentum Analysis:
- RSI: The Relative Strength Index (RSI) has been increasing, signaling strengthening momentum.
- Stochastic Oscillator: Both %K and %D values have been near or at 100, indicating strong buying pressure.
- Williams %R: The Williams %R is close to 0, suggesting the stock is nearing overbought conditions.
Volatility Analysis:
- Bollinger Bands: The Bollinger Bands have been widening, indicating increased volatility in the stock price.
- Bollinger %B: The %B value has been fluctuating within a range, reflecting the volatility in the stock.
Volume Analysis:
- On-Balance Volume (OBV): The OBV has shown mixed movements, suggesting indecision among investors.
- Chaikin Money Flow (CMF): The CMF has been slightly positive, indicating some buying pressure.
Key Observations:
- The trend indicators suggest a strong bullish sentiment with rising moving averages and positive MACD and EMA values.
- Momentum indicators point towards overbought conditions, as RSI and Stochastic Oscillator values are high.
- Volatility has increased, as seen in the widening Bollinger Bands, indicating potential price swings.
- Volume indicators show mixed signals, with OBV reflecting uncertainty and CMF slightly favoring buying pressure.
Conclusion:
Based on the analysis of the technical indicators, the stock is likely to experience a continuation of the upward trend in the next few days. The bullish momentum is supported by the positive trend indicators and strong buying pressure reflected in the momentum indicators. However, caution is advised due to the overbought conditions highlighted by the momentum indicators and the increased volatility in the stock price. Investors should closely monitor the price action and consider setting appropriate stop-loss levels to manage risk effectively.