Technical Analysis of RGA 2024-05-10
Overview:
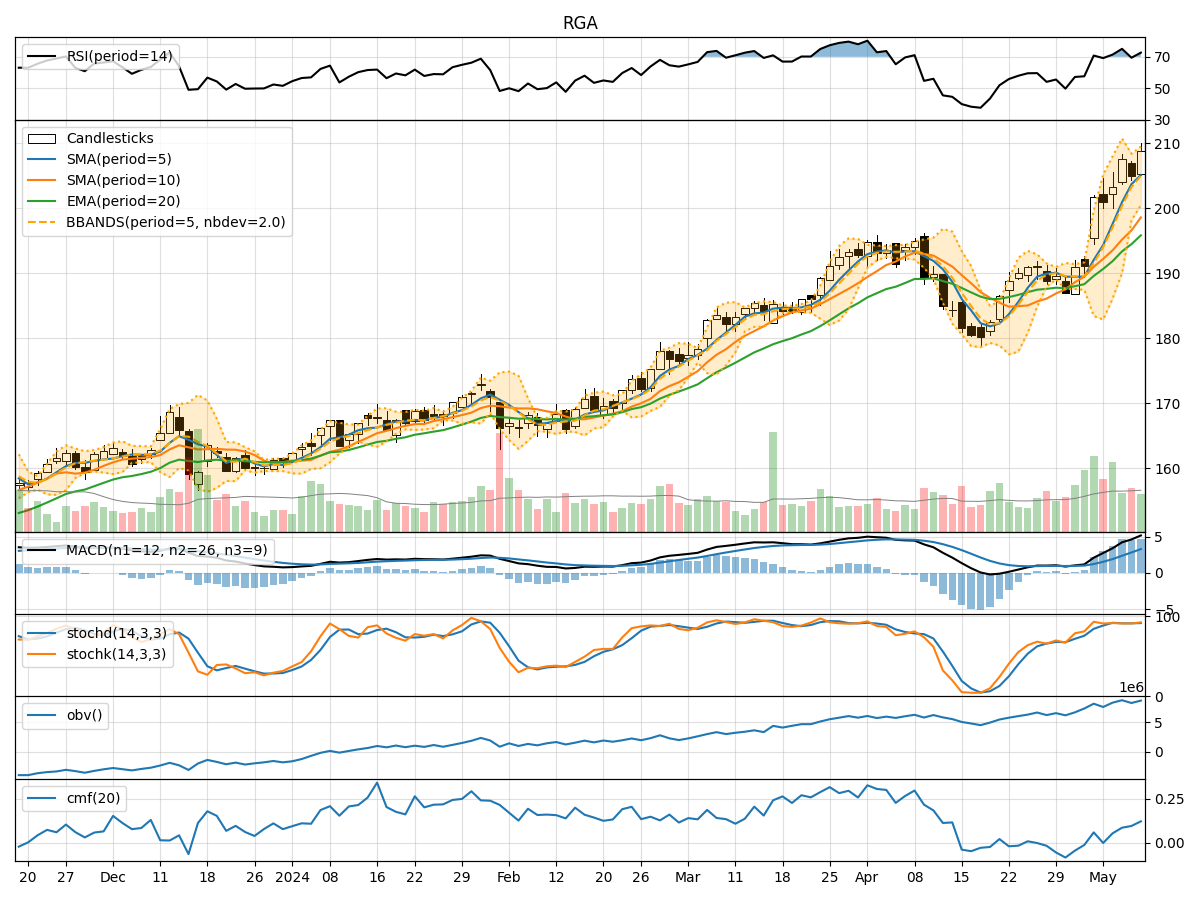
In analyzing the technical indicators for RGA over the last 5 days, we will delve into the trend, momentum, volatility, and volume indicators to provide a comprehensive outlook on the possible stock price movement in the coming days.
Trend Analysis:
- Moving Averages (MA): The 5-day Moving Average has been consistently trending above the Simple Moving Average (SMA) and Exponential Moving Average (EMA), indicating a bullish trend.
- MACD: The Moving Average Convergence Divergence (MACD) has been showing positive values, with the MACD line consistently above the Signal line, suggesting bullish momentum.
- Conclusion: The trend indicators point towards a strong bullish sentiment in the stock.
Momentum Analysis:
- RSI: The Relative Strength Index (RSI) has been fluctuating in the overbought territory, indicating strong buying momentum.
- Stochastic Oscillator: Both %K and %D lines of the Stochastic Oscillator have been in the overbought zone, signaling a strong bullish momentum.
- Conclusion: Momentum indicators suggest a strong bullish sentiment in the stock.
Volatility Analysis:
- Bollinger Bands (BB): The stock price has been consistently trading above the middle Bollinger Band (BBM), indicating an uptrend. The bands are narrowing, suggesting decreasing volatility.
- Conclusion: Volatility indicators imply a decreasing volatility environment, potentially leading to a more stable price movement.
Volume Analysis:
- On-Balance Volume (OBV): The OBV has been showing an overall positive trend, indicating accumulation by investors.
- Chaikin Money Flow (CMF): The CMF has been consistently positive over the last 5 days, suggesting strong buying pressure.
- Conclusion: Volume indicators reflect positive accumulation and buying interest in the stock.
Overall Conclusion:
Based on the analysis of trend, momentum, volatility, and volume indicators, the overall outlook for RGA stock is strongly bullish. The trend is positive, momentum is strong, volatility is decreasing, and volume is indicating accumulation. Therefore, the next few days are likely to see the stock price continue its upward trajectory.
Recommendation:
Considering the overwhelmingly bullish signals from the technical indicators, it is advisable to consider buying RGA stock for potential short to medium-term gains. Traders and investors could capitalize on the current momentum and positive trend to benefit from the anticipated price appreciation.
Disclaimer:
Remember that while technical analysis provides valuable insights, it is essential to consider other factors and conduct thorough research before making investment decisions. Market conditions can change rapidly, so it is crucial to stay informed and adapt your strategies accordingly.