Technical Analysis of RHI 2024-05-10
Overview:
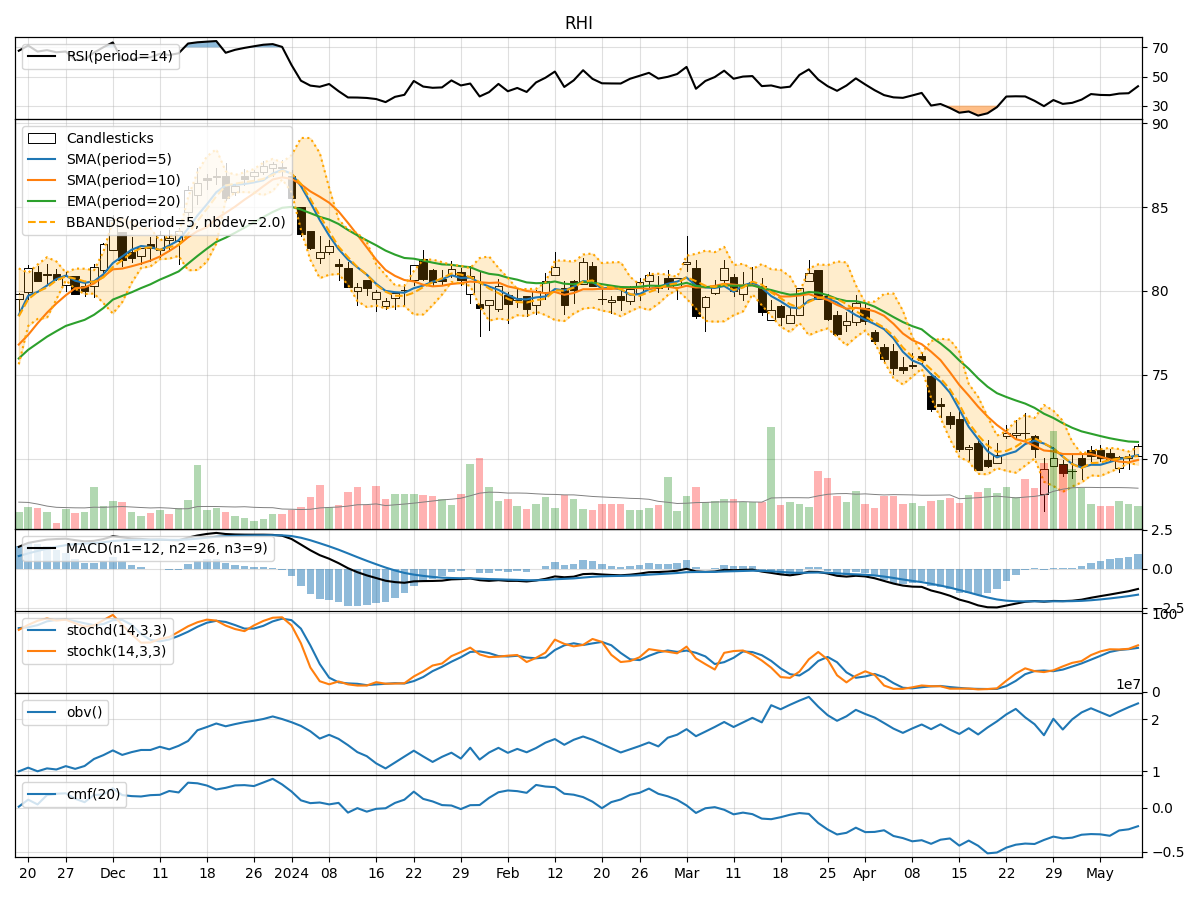
In the last 5 trading days, RHI stock has shown a relatively stable performance with minor fluctuations in price and volume. By analyzing various technical indicators including trend, momentum, volatility, and volume, we can gain insights into the potential future price movement of RHI stock.
Trend Analysis:
- Moving Averages (MA): The 5-day Moving Average (MA) has been hovering around the closing prices, indicating a short-term trend. The Simple Moving Average (SMA) and Exponential Moving Average (EMA) suggest a slightly bearish trend as they are below the current price.
- MACD: The Moving Average Convergence Divergence (MACD) is negative, indicating a bearish momentum in the stock price.
Momentum Analysis:
- RSI: The Relative Strength Index (RSI) is below 50, indicating a neutral to slightly bearish momentum.
- Stochastic Oscillator: Both %K and %D are in the overbought zone, suggesting a potential reversal or consolidation.
Volatility Analysis:
- Bollinger Bands (BB): The stock price has been trading within the Bollinger Bands, with the bands narrowing, indicating decreasing volatility.
Volume Analysis:
- On-Balance Volume (OBV): The OBV has been relatively stable, indicating a balance between buying and selling pressure.
- Chaikin Money Flow (CMF): The CMF is negative, suggesting a bearish money flow in the stock.
Key Observations:
- The trend indicators show a bearish bias with prices below key moving averages.
- Momentum indicators suggest a neutral to slightly bearish sentiment.
- Volatility has been decreasing, indicating a potential period of consolidation.
- Volume indicators show a balance between buying and selling pressure, with a slight bearish money flow.
Conclusion:
Based on the analysis of technical indicators, the next few days' possible stock price movement for RHI is likely to be sideways with a slight bearish bias. Traders should watch for potential support levels near the lower Bollinger Band and monitor for any signs of a reversal in momentum indicators. It is advisable to exercise caution and wait for clearer signals before making significant trading decisions.