Technical Analysis of RIG 2024-05-10
Overview:
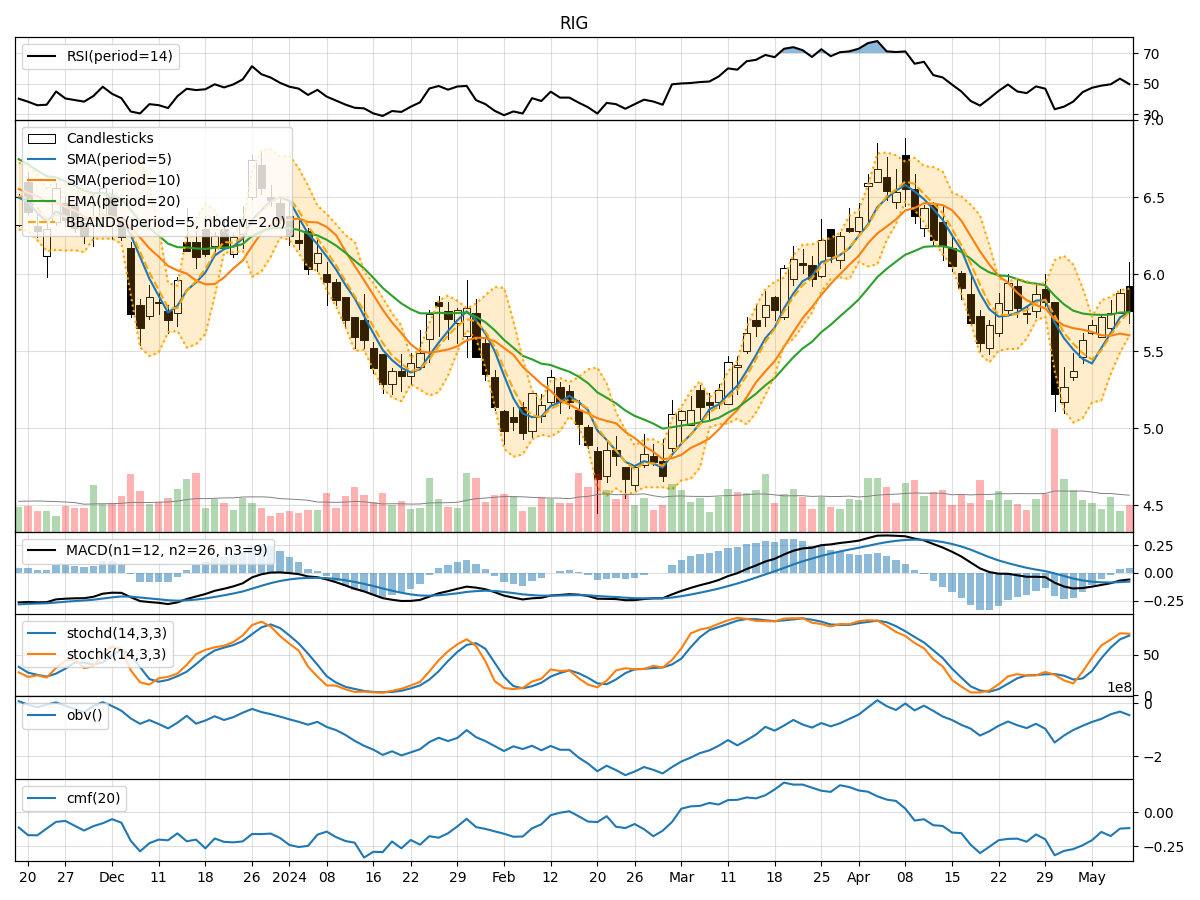
In analyzing the technical indicators for RIG over the last 5 days, we will delve into the trend, momentum, volatility, and volume indicators to provide a comprehensive outlook on the possible stock price movement in the coming days. By examining these key indicators, we aim to offer valuable insights and predictions for potential investors or traders.
Trend Analysis:
- Moving Averages (MA): The 5-day Moving Average (MA) has been consistently above the Simple Moving Average (SMA) and Exponential Moving Average (EMA) over the past 5 days, indicating a short-term bullish trend.
- MACD: The Moving Average Convergence Divergence (MACD) has been negative but showing signs of convergence towards the signal line, suggesting a possible trend reversal.
- RSI: The Relative Strength Index (RSI) has been fluctuating around the neutral zone, indicating indecision in the market sentiment.
Momentum Analysis:
- Stochastic Oscillator: The Stochastic Oscillator has been in the overbought territory, signaling a potential reversal or consolidation phase.
- Williams %R: The Williams %R indicator has been in the oversold region, suggesting a possible buying opportunity in the near term.
Volatility Analysis:
- Bollinger Bands: The Bollinger Bands have been narrowing, indicating decreasing volatility and a potential breakout or breakdown in the stock price.
- Average True Range (ATR): The ATR has been relatively stable, suggesting a lack of significant price movements in the short term.
Volume Analysis:
- On-Balance Volume (OBV): The OBV has been fluctuating, indicating mixed buying and selling pressure in the market.
- Chaikin Money Flow (CMF): The CMF has been negative, reflecting a bearish money flow trend in the stock.
Key Observations:
- The trend indicators suggest a potential reversal or consolidation phase in the stock price.
- Momentum indicators point towards a mixed sentiment with overbought and oversold conditions.
- Volatility indicators indicate a potential breakout or breakdown scenario.
- Volume indicators show a lack of strong buying or selling pressure in the market.
Conclusion:
Based on the analysis of the technical indicators, the stock price of RIG is likely to experience sideways movement in the coming days. The mixed signals from the trend, momentum, volatility, and volume indicators suggest a lack of clear direction in the near term. Traders and investors should exercise caution and wait for more definitive signals before making any significant trading decisions.