Technical Analysis of RITM 2024-05-10
Overview:
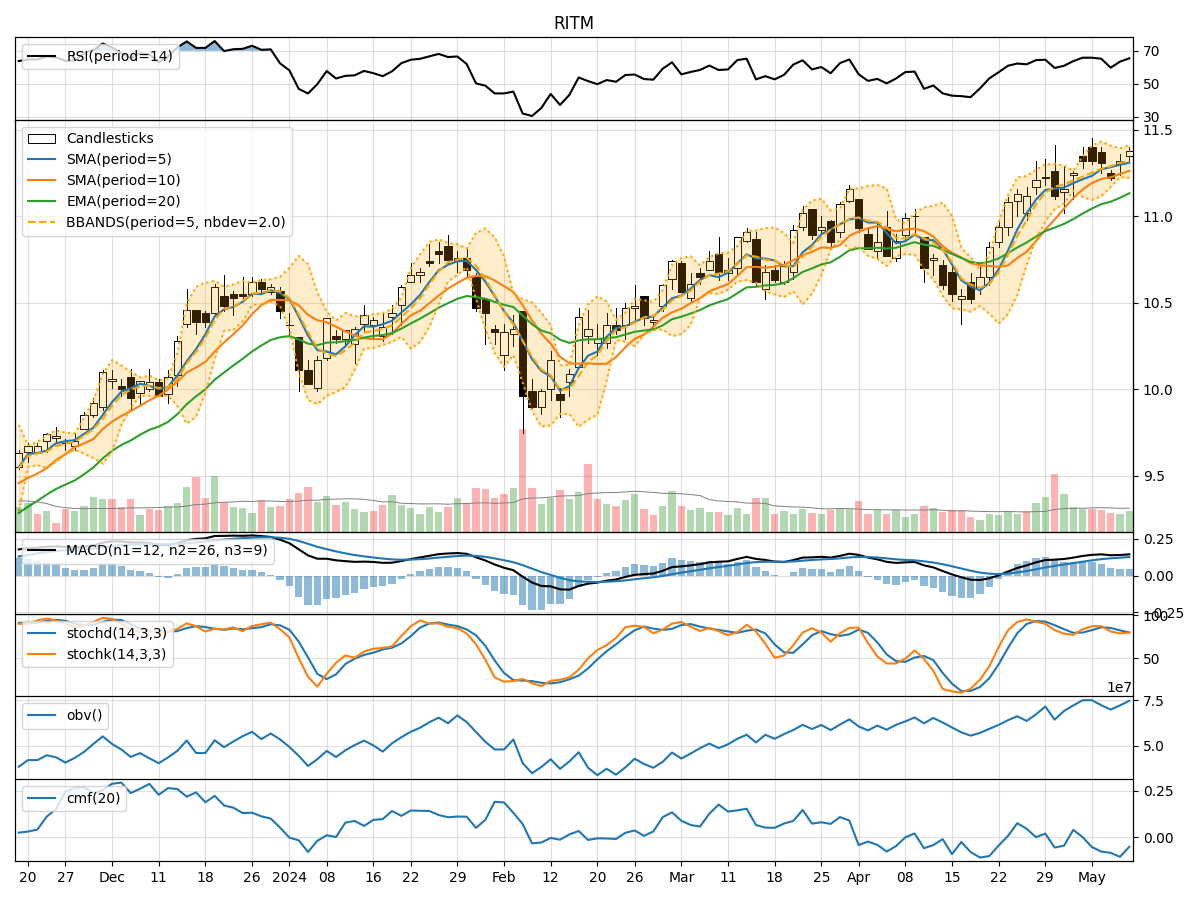
In analyzing the technical indicators for RITM over the last 5 days, we will delve into the trend, momentum, volatility, and volume indicators to provide a comprehensive outlook on the possible stock price movement. By examining these key indicators, we aim to offer valuable insights and predictions for the upcoming days.
Trend Analysis:
- Moving Averages (MA): The 5-day Moving Average has been steadily increasing, indicating a positive trend in the stock price.
- MACD: The MACD line has been consistently above the signal line, suggesting bullish momentum.
- EMA: The Exponential Moving Average has been trending upwards, supporting the bullish sentiment.
Key Observation: The trend indicators point towards an upward trajectory for the stock price.
Momentum Analysis:
- RSI: The Relative Strength Index has been in the overbought territory, indicating strong buying momentum.
- Stochastic Oscillator: Both %K and %D have been relatively high, suggesting bullish momentum.
- Williams %R: The indicator has been hovering in the oversold region, signaling potential buying opportunities.
Key Observation: Momentum indicators reflect a bullish sentiment in the market.
Volatility Analysis:
- Bollinger Bands: The bands have been relatively narrow, indicating low volatility in the stock price.
- Bollinger %B: The %B indicator has been fluctuating within a tight range, suggesting stability in price movements.
Key Observation: Volatility indicators point towards a sideways movement in the stock price.
Volume Analysis:
- On-Balance Volume (OBV): The OBV has shown a slight increase, indicating accumulation of the stock.
- Chaikin Money Flow (CMF): The CMF has been negative, suggesting outflow of money from the stock.
Key Observation: Volume indicators suggest a neutral to slightly bearish outlook for the stock.
Conclusion:
Based on the analysis of trend, momentum, volatility, and volume indicators, the overall outlook for RITM stock in the next few days is as follows: - Trend: Upward - Momentum: Bullish - Volatility: Sideways - Volume: Neutral to slightly bearish
Final Recommendation:
Considering the bullish trend and momentum, along with stable volatility, there is a high probability of the stock price continuing its upward movement in the next few days. However, the slightly bearish volume indicators suggest a cautious approach. Traders may consider entering long positions with proper risk management strategies in place to capitalize on the potential upside while being mindful of volume dynamics.