Technical Analysis of RKT 2024-05-10
Overview:
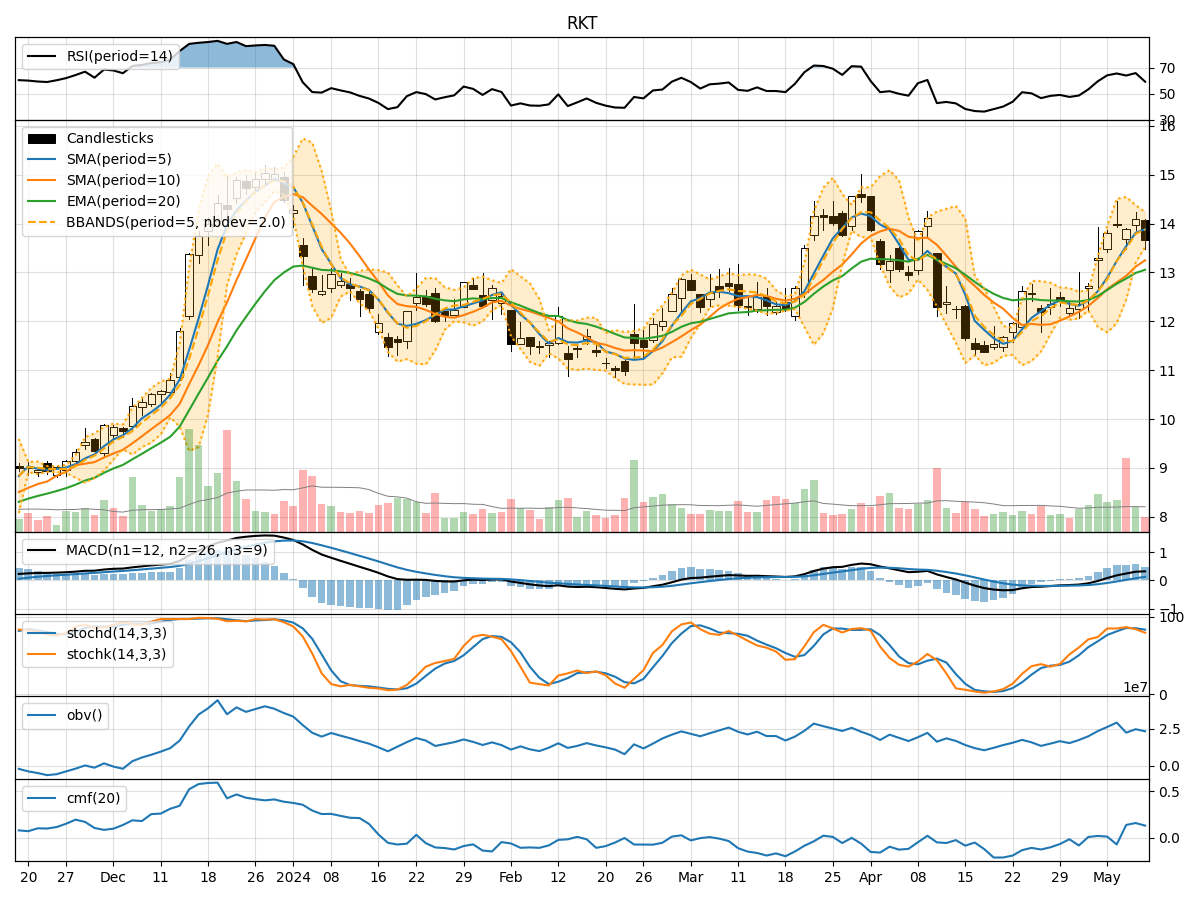
In analyzing the technical indicators for RKT over the last 5 days, we will delve into the trend, momentum, volatility, and volume indicators to provide a comprehensive outlook on the possible stock price movement in the coming days.
Trend Indicators:
- Moving Averages (MA): The 5-day Moving Average has been consistently above the Simple Moving Average (SMA) of 10 days, indicating a short-term bullish trend.
- Exponential Moving Average (EMA): The EMA has been steadily increasing, reflecting positive price momentum.
- Moving Average Convergence Divergence (MACD): The MACD and Signal Line have shown an upward trend, suggesting bullish momentum.
Key Observation: The trend indicators point towards a bullish sentiment in the short term.
Momentum Indicators:
- Relative Strength Index (RSI): RSI values have been fluctuating around the overbought territory, indicating strong buying pressure.
- Stochastic Oscillator: Both %K and %D have been relatively high, suggesting an overbought condition.
- Williams %R (Willams %R): The indicator has been in the oversold region, signaling a potential reversal.
Key Observation: Momentum indicators suggest a mixed sentiment with overbought conditions, potentially leading to a short-term correction.
Volatility Indicators:
- Bollinger Bands (BB): The price has been trading within the bands, indicating moderate volatility.
- Bollinger Band %B (BB %B): The %B value has been fluctuating around the midline, suggesting a balanced market sentiment.
Key Observation: Volatility indicators imply a stable market with no extreme price movements expected.
Volume Indicators:
- On-Balance Volume (OBV): The OBV has shown mixed movements, indicating indecision among investors.
- Chaikin Money Flow (CMF): The CMF has been positive, reflecting buying pressure in the market.
Key Observation: Volume indicators suggest a neutral stance with no clear direction in trading volume.
Conclusion:
Based on the analysis of the technical indicators, the short-term outlook for RKT stock price movement is bullish with a potential for a short-term correction due to overbought conditions indicated by momentum indicators. The stable volatility and neutral volume indicators suggest a consolidation phase in the near future. Traders should monitor the price closely for potential entry or exit points based on these technical signals.