Technical Analysis of RLI 2024-05-10
Overview:
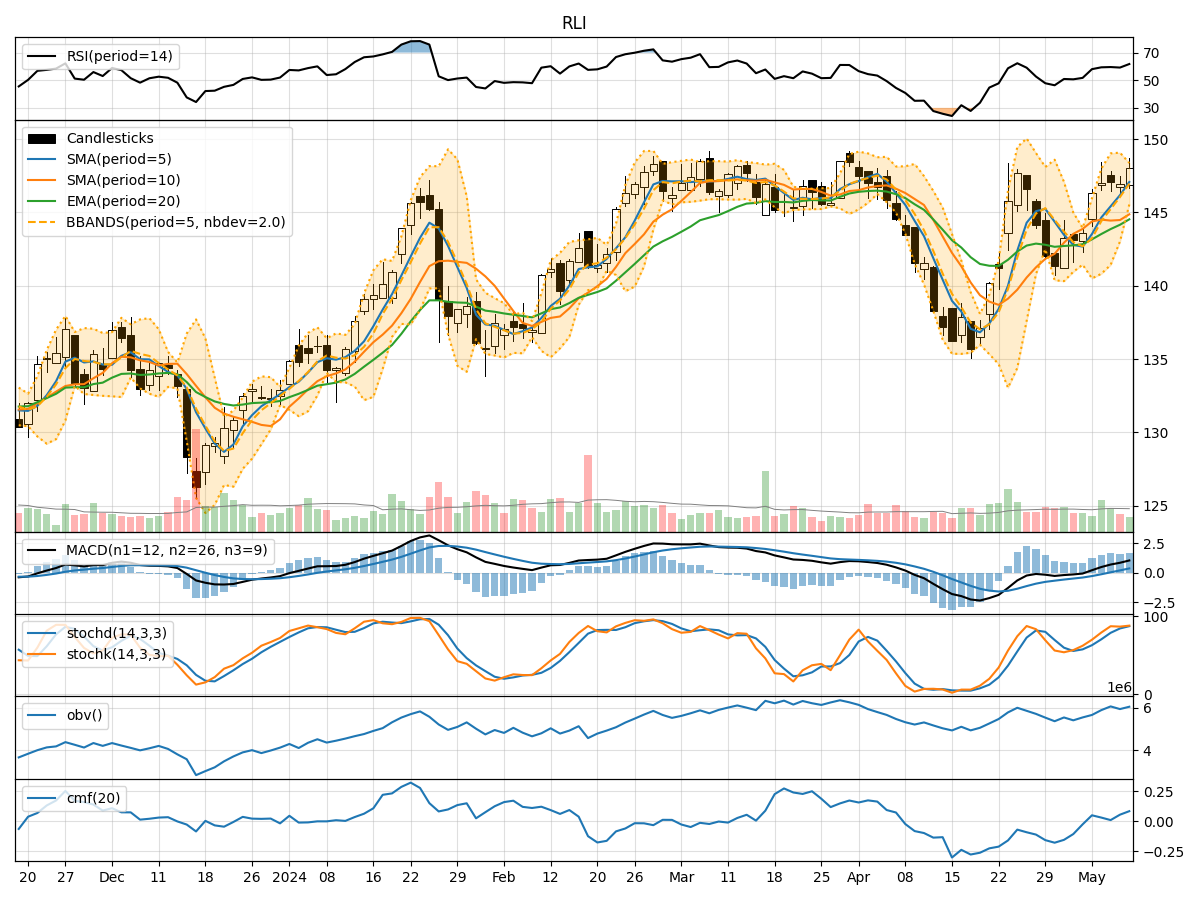
In analyzing the technical indicators for RLI over the last 5 days, we will delve into the trend, momentum, volatility, and volume indicators to provide a comprehensive outlook on the possible stock price movement in the coming days.
Trend Analysis:
- Moving Averages (MA): The 5-day Moving Average (MA) has been consistently rising, indicating a bullish trend.
- MACD: The MACD line has been above the signal line for the past few days, suggesting a bullish momentum.
- EMA: The Exponential Moving Average (EMA) has been trending upwards, supporting the bullish sentiment.
Momentum Analysis:
- RSI: The Relative Strength Index (RSI) has been in the neutral to slightly overbought territory, indicating potential strength in the stock.
- Stochastic Oscillator: Both %K and %D have been in the overbought zone, signaling a strong bullish momentum.
- Williams %R: The Williams %R is in the oversold region, suggesting a potential reversal or consolidation.
Volatility Analysis:
- Bollinger Bands: The stock price has been trading within the upper Bollinger Band, indicating increased volatility and a potential continuation of the uptrend.
- Bollinger %B: The %B indicator is above 0.8, suggesting that the stock is trading near the upper band, potentially indicating an overbought condition.
Volume Analysis:
- On-Balance Volume (OBV): The OBV has been increasing, indicating accumulation by investors.
- Chaikin Money Flow (CMF): The CMF has been positive, suggesting buying pressure in the stock.
Key Observations:
- The trend indicators, momentum indicators, and volume indicators all point towards a bullish sentiment in the stock.
- The volatility indicators suggest that the stock is experiencing increased price fluctuations but remains in an uptrend.
Conclusion:
Based on the analysis of the technical indicators, the next few days' possible stock price movement for RLI is likely to be bullish. The trend is positive, momentum is strong, volume is increasing, and volatility is supporting the uptrend. Traders and investors may consider looking for buying opportunities or holding onto existing positions to capitalize on the expected upward movement in the stock price.