Technical Analysis of RNG 2024-05-10
Overview:
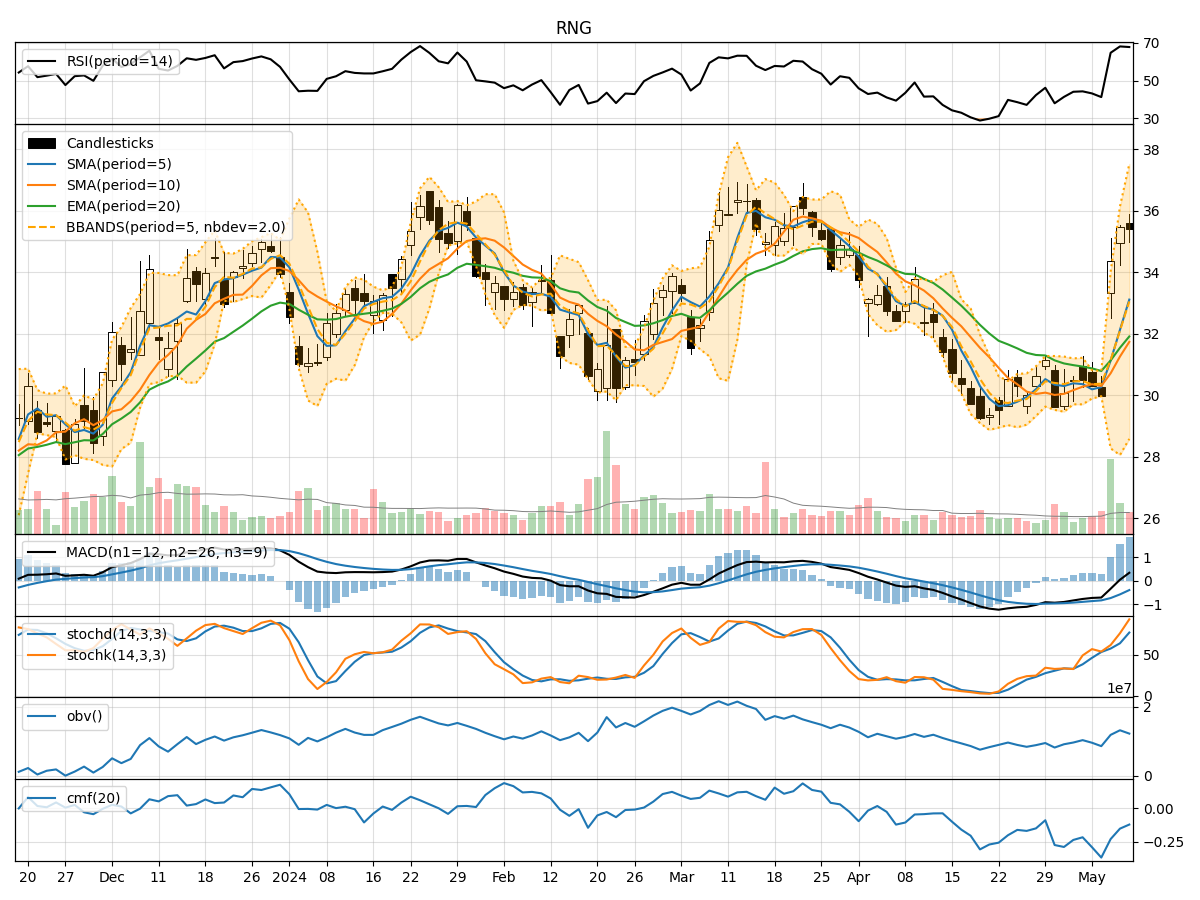
In analyzing the technical indicators for RNG over the last 5 days, we will delve into the trend, momentum, volatility, and volume indicators to provide a comprehensive outlook on the possible stock price movement in the coming days. By examining these key indicators, we aim to offer valuable insights and predictions for potential investors.
Trend Analysis:
- Moving Averages (MA): The 5-day MA has been showing an upward trend, indicating a positive momentum in the stock price.
- MACD: The MACD line has been consistently above the signal line, suggesting a bullish trend.
- EMA: The EMA has been gradually increasing, supporting the bullish sentiment in the short to medium term.
Momentum Analysis:
- RSI: The RSI has been trending upwards, indicating increasing buying pressure and potential further upside.
- Stochastic Oscillator: Both %K and %D have been in the overbought zone, signaling a strong bullish momentum.
- Williams %R: The indicator has been hovering in the oversold territory, suggesting a potential reversal to the upside.
Volatility Analysis:
- Bollinger Bands (BB): The bands have been widening, indicating increased volatility in the stock price.
- BB %B: The %B indicator has been fluctuating but remains above 0.5, suggesting a bullish bias.
- BB Width: The widening of the bands implies potential significant price movements in the near future.
Volume Analysis:
- On-Balance Volume (OBV): The OBV has shown mixed signals, with fluctuations in volume accumulation/distribution.
- Chaikin Money Flow (CMF): The CMF has been negative, indicating some selling pressure in the stock.
Key Observations:
- The trend indicators suggest a bullish sentiment with positive moving averages and MACD.
- Momentum indicators point towards a strong buying momentum with RSI and Stochastic in overbought territory.
- Volatility indicators indicate increased price fluctuations and potential significant movements.
- Volume indicators show mixed signals with OBV and CMF, reflecting uncertainty in volume accumulation.
Conclusion:
Based on the analysis of the technical indicators, the next few days for RNG are likely to see continued upward movement in the stock price. The bullish trend supported by moving averages, MACD, RSI, and Stochastic indicators indicates a positive outlook. However, investors should remain cautious of the increased volatility as indicated by the Bollinger Bands. Overall, the stock is poised for further upside potential in the near term.