Technical Analysis of RS 2024-05-10
Overview:
In analyzing the provided RS TA data for the last 5 days, we will delve into the technical indicators across trend, momentum, volatility, and volume to derive insights into the possible future stock price movement. By examining each indicator category and drawing conclusions based on the data, we aim to provide a comprehensive and informed perspective on the stock's potential trajectory.
Trend Analysis:
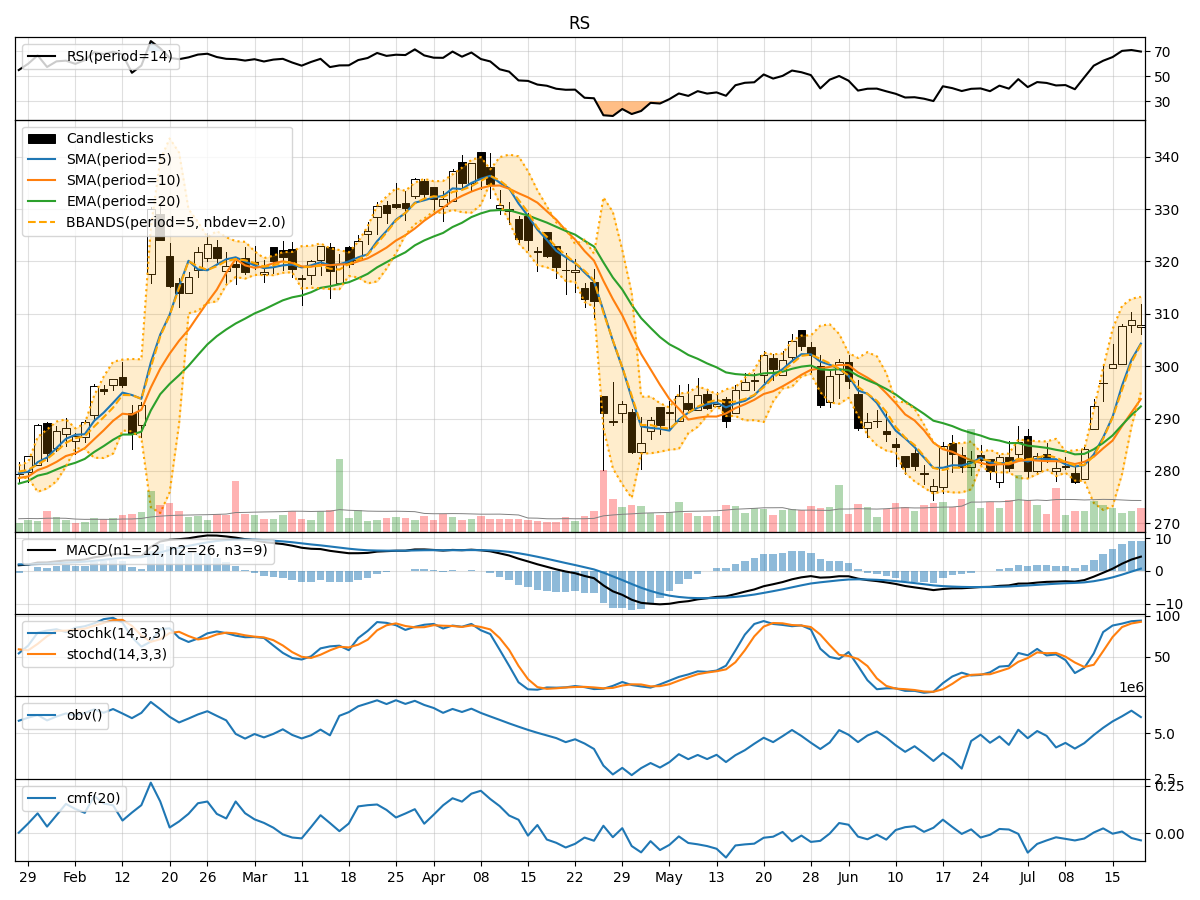
- Moving Averages (MA): The 5-day MA has been fluctuating around the SMA(10) and EMA(20), indicating a lack of clear trend direction.
- MACD: The MACD line has been consistently below the signal line, suggesting a bearish momentum in the short term.
- RSI: The RSI values have been hovering around the mid-range, indicating a neutral sentiment in terms of price momentum.
Momentum Analysis:
- Stochastic Oscillator: The Stochastic indicators have shown some upward movement but remain below the overbought threshold, suggesting a potential for further upside.
- Williams %R: The Williams %R values have been fluctuating but are currently not in extreme overbought or oversold territory.
Volatility Analysis:
- Bollinger Bands: The stock price has been trading within the Bollinger Bands, with the bands narrowing, indicating a potential decrease in volatility.
- BB% (Bollinger Band %B): The %B value is relatively low, suggesting the stock is trading closer to the lower band.
Volume Analysis:
- On-Balance Volume (OBV): The OBV has shown a mixed trend, indicating some distribution of shares.
- Chaikin Money Flow (CMF): The CMF has been negative, reflecting selling pressure in the stock.
Conclusion:
Based on the analysis of the technical indicators, the stock is currently exhibiting a sideways trend with bearish momentum in the short term. The volatility is decreasing, and the volume indicators suggest a mixed sentiment with a slight bias towards selling pressure. Considering these factors, the next few days are likely to see the stock price continue its sideways movement with a potential for further downside if the bearish momentum persists. Traders should exercise caution and consider waiting for more definitive signals before making significant trading decisions.