Technical Analysis of RSKD 2024-05-10
Overview:
In analyzing the technical indicators for RSKD over the last 5 days, we will delve into the trend, momentum, volatility, and volume indicators to provide a comprehensive outlook on the possible stock price movement in the coming days. By examining these key aspects, we aim to offer valuable insights and recommendations for potential investors.
Trend Analysis:
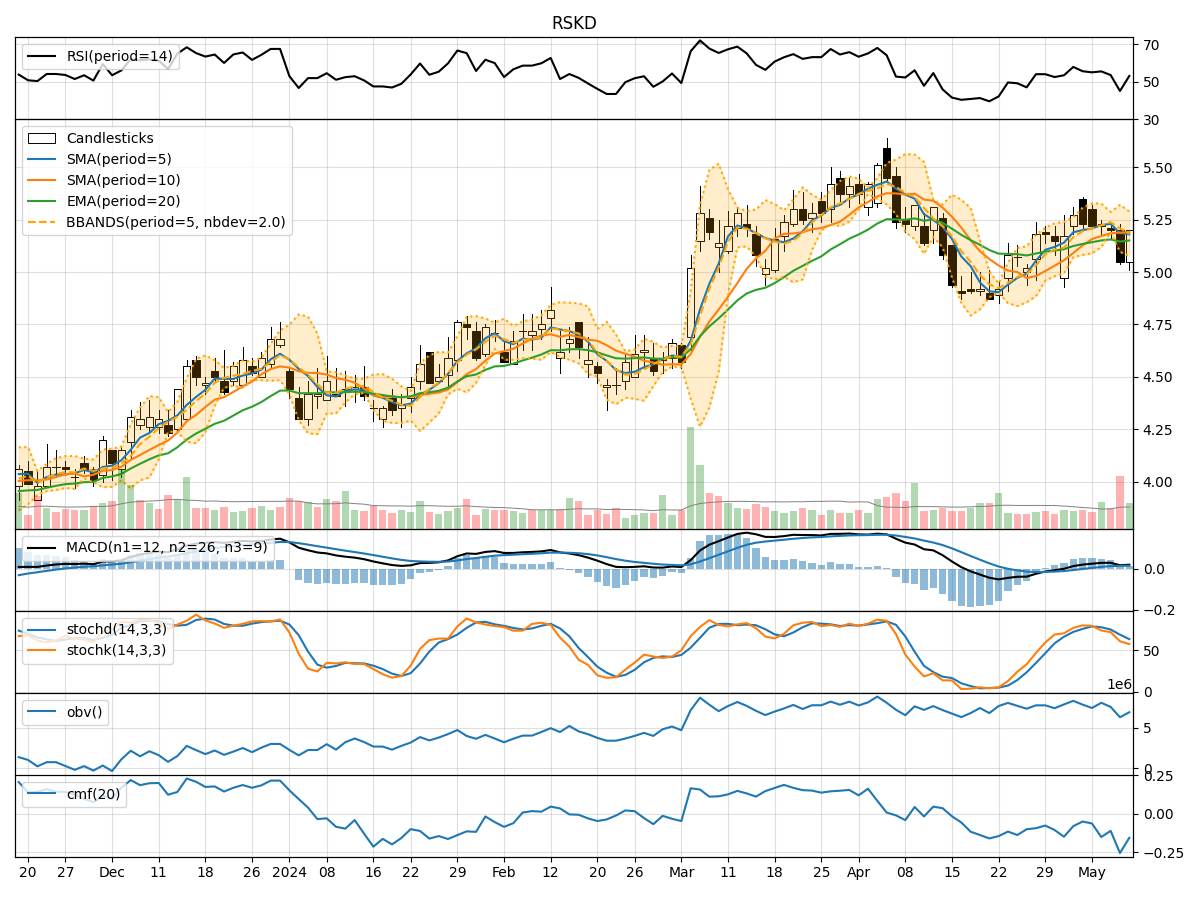
- Moving Averages (MA): The 5-day Moving Average (MA) has been relatively stable around the closing prices, indicating a consistent trend.
- MACD: The Moving Average Convergence Divergence (MACD) has shown positive values, suggesting a bullish momentum in the short term.
- EMA: The Exponential Moving Average (EMA) has been slightly increasing, reflecting a positive trend.
Momentum Analysis:
- RSI: The Relative Strength Index (RSI) has fluctuated but generally stayed within the neutral range, indicating a balanced momentum.
- Stochastic Oscillator: Both %K and %D have shown a downward trend, signaling a potential weakening momentum.
- Williams %R: The Williams %R has been in the oversold territory, suggesting a possible reversal in momentum.
Volatility Analysis:
- Bollinger Bands: The Bollinger Bands have shown narrowing bands, indicating decreasing volatility.
- Bollinger %B: The %B indicator has been relatively stable, suggesting a consolidation phase.
- Average True Range (ATR): The ATR has decreased, indicating lower volatility in the stock.
Volume Analysis:
- On-Balance Volume (OBV): The OBV has shown mixed movements, reflecting indecision among investors.
- Chaikin Money Flow (CMF): The CMF has been negative, indicating selling pressure in the stock.
Key Observations:
- The trend indicators suggest a slightly bullish sentiment in the short term.
- Momentum indicators show a mixed picture with a potential shift in momentum.
- Volatility has decreased, indicating a possible consolidation phase.
- Volume indicators reflect uncertainty and selling pressure in the stock.
Conclusion:
Based on the analysis of the technical indicators, the next few days for RSKD stock may see sideways movement with a slight bullish bias. Investors should closely monitor key support and resistance levels for potential entry or exit points. It is advisable to wait for more confirmation from the indicators before making significant trading decisions.