Technical Analysis of RYAN 2024-05-10
Overview:
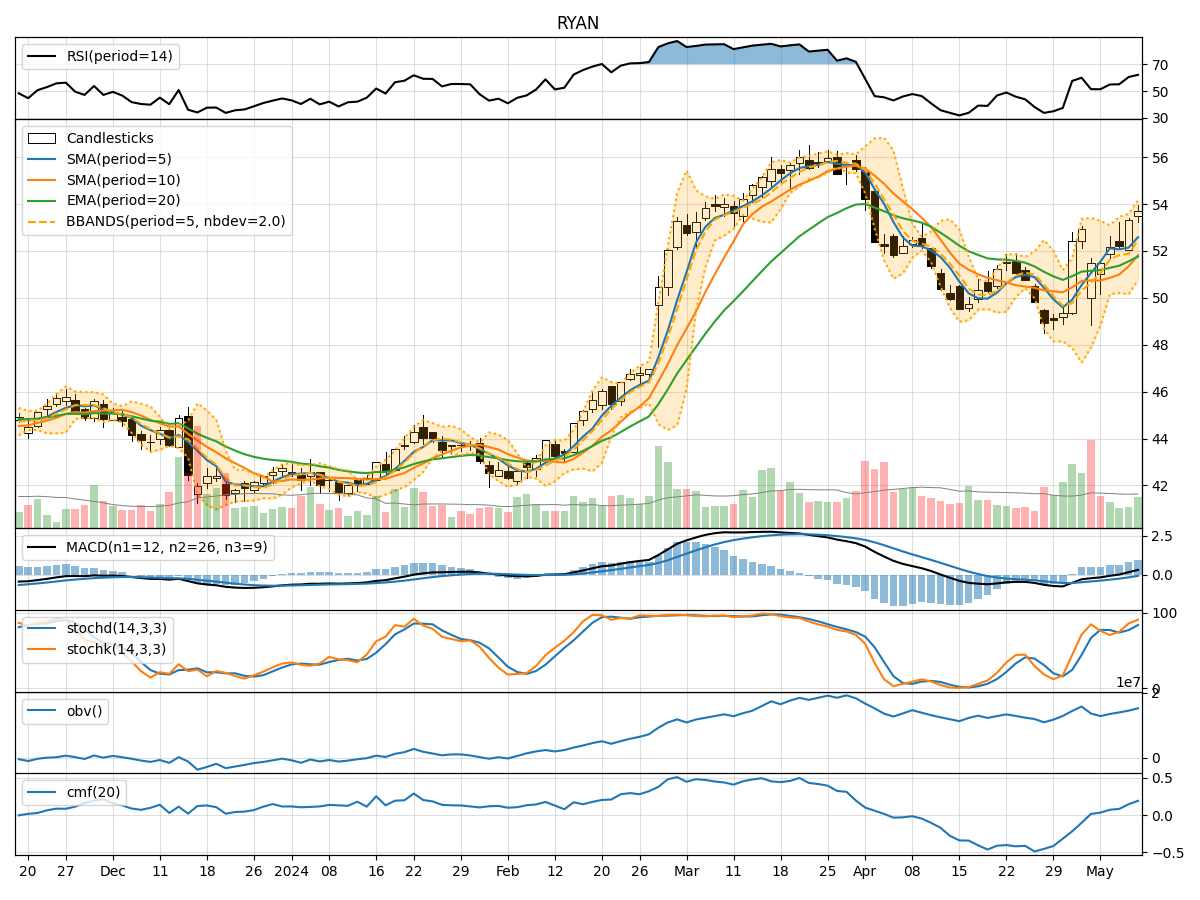
In analyzing the technical indicators for RYAN stock over the last 5 days, we will delve into the trends, momentum, volatility, and volume indicators to provide a comprehensive outlook on the possible stock price movement in the coming days.
Trend Analysis:
- Moving Averages (MA): The 5-day Moving Average (MA) has been consistently above the Simple Moving Average (SMA) and Exponential Moving Average (EMA), indicating a bullish trend.
- MACD: The MACD line has been consistently above the signal line, with both lines showing an upward trend, suggesting bullish momentum.
- MACD Histogram: The MACD Histogram has been increasing over the past 5 days, indicating strengthening bullish momentum.
Momentum Analysis:
- RSI: The Relative Strength Index (RSI) has been increasing and is currently in the overbought territory, suggesting a strong bullish momentum.
- Stochastic Oscillator: Both %K and %D lines of the Stochastic Oscillator are in the overbought zone, indicating a strong bullish momentum.
- Williams %R: The Williams %R is in the oversold territory, suggesting a potential reversal in the bullish momentum.
Volatility Analysis:
- Bollinger Bands: The stock price has been consistently trading above the middle Bollinger Band (BBM), indicating an upward trend.
- Bollinger %B: The Bollinger %B is above 0.5, suggesting that the stock price is trading above the middle band and is in a bullish phase.
Volume Analysis:
- On-Balance Volume (OBV): The OBV has been steadily increasing over the last 5 days, indicating strong buying pressure.
- Chaikin Money Flow (CMF): The CMF is positive and has been increasing, indicating that money is flowing into the stock.
Conclusion:
Based on the analysis of the technical indicators, the stock of RYAN is exhibiting strong bullish momentum across all categories. The trend indicators, momentum oscillators, volatility bands, and volume indicators all point towards a continuation of the upward trend in the stock price.
Forecast:
Considering the current bullish sentiment and the strength in the technical indicators, it is likely that RYAN stock will continue its upward trajectory in the coming days. Traders and investors may consider buying opportunities to capitalize on the bullish momentum in the stock.