Technical Analysis of SA 2024-05-10
Overview:
In analyzing the technical indicators for the last 5 days of the stock, we will delve into the trends, momentum, volatility, and volume indicators to provide a comprehensive outlook on the possible stock price movement in the coming days. By examining these key aspects, we aim to offer valuable insights and predictions for informed decision-making.
Trend Indicators:
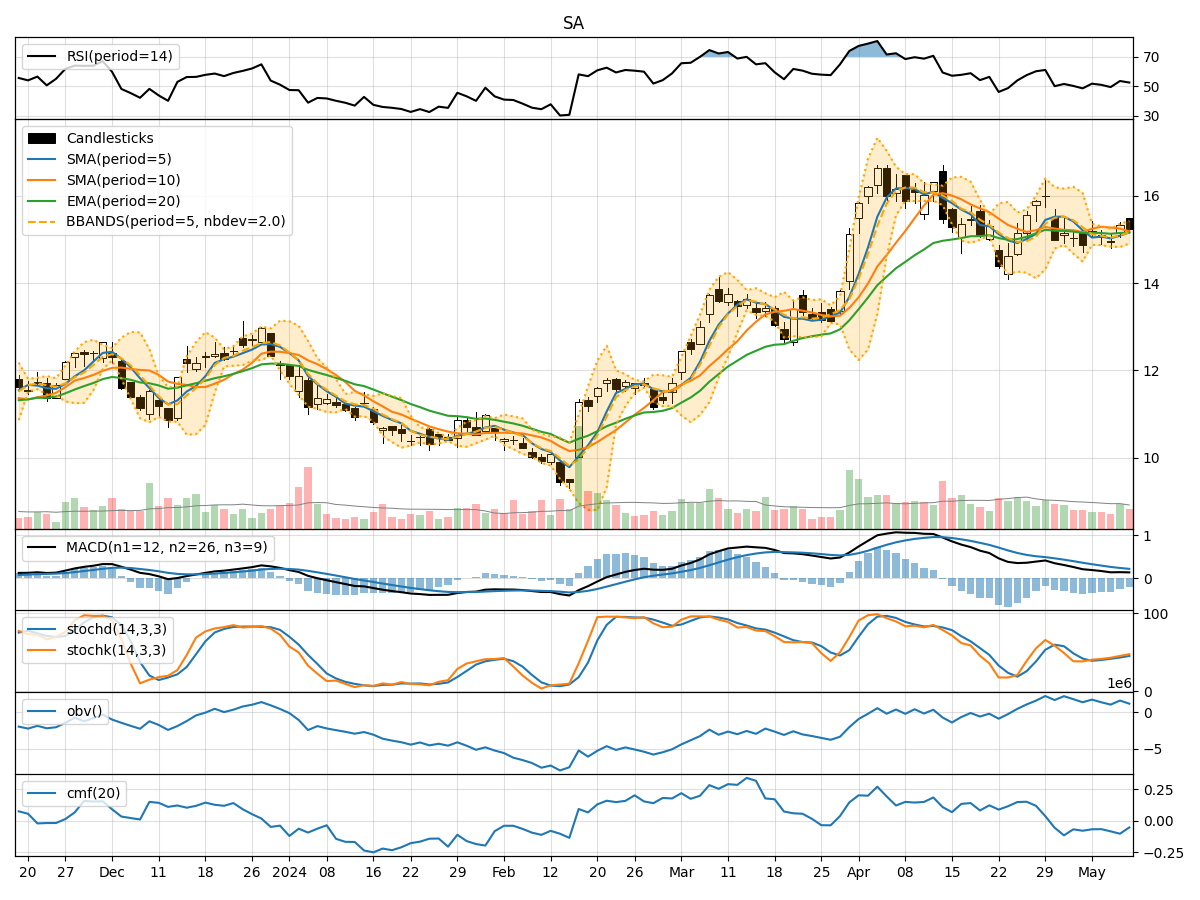
- Moving Averages (MA): The 5-day Moving Average (MA) has been fluctuating around the closing prices, indicating short-term price trends. The Simple Moving Average (SMA) and Exponential Moving Average (EMA) show a slight downward trend, suggesting a potential bearish sentiment.
- Moving Average Convergence Divergence (MACD): The MACD and Signal Line have been converging towards each other, indicating a possible trend reversal. The MACD Histogram is negative but decreasing, signaling a weakening bearish momentum.
Momentum Indicators:
- Relative Strength Index (RSI): The RSI has been hovering around the mid-level, indicating a neutral stance in terms of momentum. There is no clear overbought or oversold signal.
- Stochastic Oscillator: Both %K and %D lines of the Stochastic Oscillator are rising, suggesting a potential bullish momentum building up. However, they are not in the overbought territory yet.
- Williams %R (Willams %R): The Williams %R is in the oversold region, indicating a potential buying opportunity. However, it should be noted that it has been in this zone for a few days, so caution is advised.
Volatility Indicators:
- Bollinger Bands (BB): The Bollinger Bands are narrowing, indicating decreasing volatility. The price has been trading within the bands, suggesting a period of consolidation. The %B indicator is below 1, indicating the price is below the upper band.
Volume Indicators:
- On-Balance Volume (OBV): The OBV has been fluctuating, indicating a balance between buying and selling pressure. There is no clear trend in volume accumulation.
- Chaikin Money Flow (CMF): The CMF is negative, suggesting a slight outflow of money from the stock. This could be due to profit-taking or lack of strong buying interest.
Conclusion:
Based on the analysis of the technical indicators, the stock is currently in a consolidation phase with a slight bearish bias. The narrowing Bollinger Bands and decreasing volatility indicate a period of price stabilization. The momentum indicators show mixed signals, with the Stochastic Oscillator hinting at a potential bullish momentum shift. However, the overall lack of strong buying volume and the neutral RSI suggest a cautious approach.
Recommendation:
Considering the current market dynamics, it is advisable to monitor the price action closely for any breakout from the consolidation range. A confirmation of a bullish trend would require a sustained increase in buying volume and a clear move above key resistance levels. Traders should exercise caution and wait for a clearer signal before taking significant positions.