Technical Analysis of SAH 2024-05-10
Overview:
In analyzing the technical indicators for SAH stock over the last 5 days, we will delve into the trend, momentum, volatility, and volume indicators to provide a comprehensive outlook on the possible stock price movement in the coming days. By examining these key indicators, we aim to offer valuable insights and predictions for potential investors.
Trend Analysis:
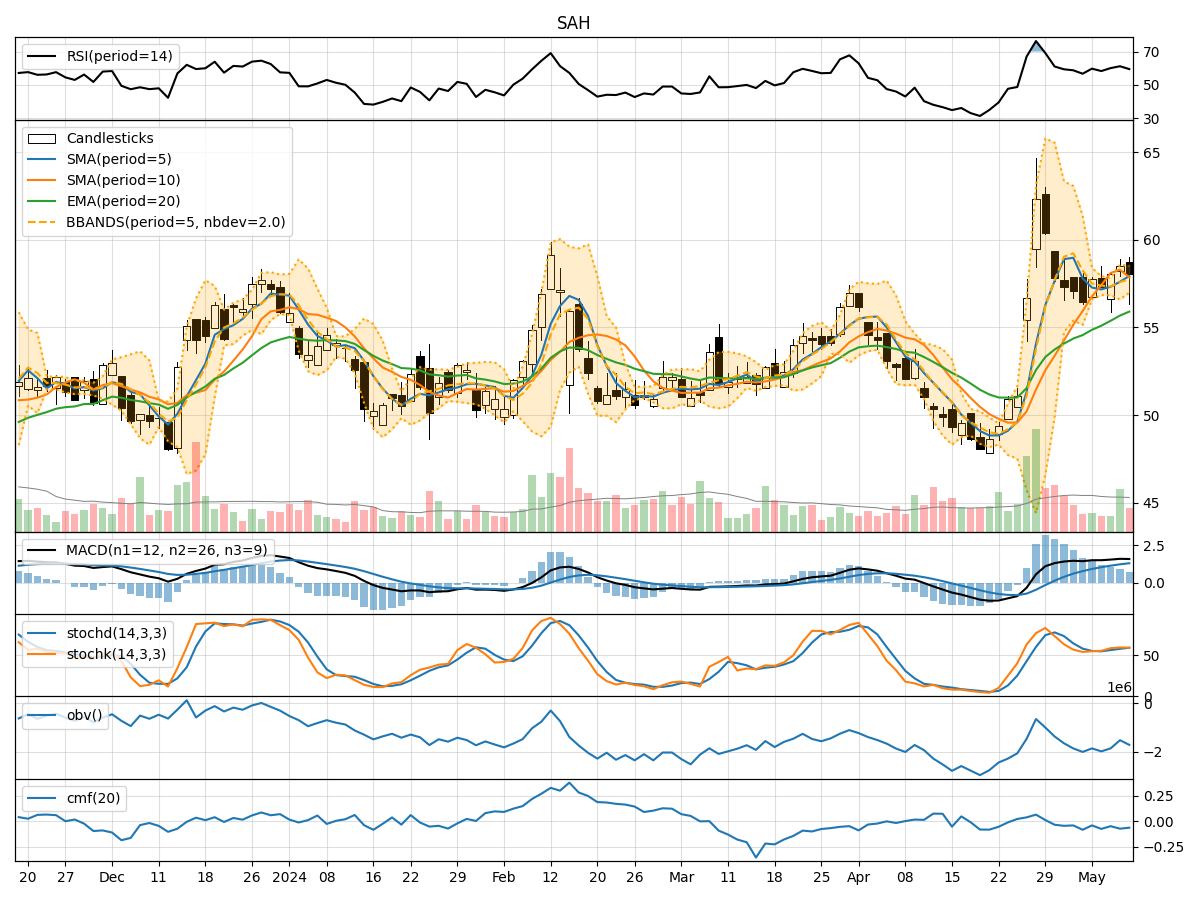
- Moving Averages (MA): The 5-day Moving Average (MA) has been consistently above the Simple Moving Average (SMA) and Exponential Moving Average (EMA), indicating a bullish trend.
- MACD: The MACD line has been above the signal line, with both lines showing an upward trend, suggesting bullish momentum.
- RSI: The Relative Strength Index (RSI) has been fluctuating around the 60 level, indicating a neutral to slightly bullish sentiment.
Momentum Analysis:
- Stochastic Oscillator: Both %K and %D lines of the Stochastic Oscillator have been in the overbought zone, signaling a potential reversal or consolidation.
- Williams %R: The Williams %R indicator has been consistently in the oversold territory, suggesting a bearish sentiment.
Volatility Analysis:
- Bollinger Bands (BB): The stock price has been trading within the Bollinger Bands, with the bands widening slightly, indicating increased volatility.
- BB% (Bollinger Band Percentage): The BB% has been relatively low, suggesting a potential breakout or significant price movement.
Volume Analysis:
- On-Balance Volume (OBV): The OBV has shown mixed signals, with some days experiencing selling pressure and others showing accumulation.
- Chaikin Money Flow (CMF): The CMF has been negative, indicating a bearish money flow trend.
Conclusion:
Based on the analysis of the technical indicators, the next few days' possible stock price movement for SAH is likely to be sideways to slightly bearish. The Stochastic Oscillator and Williams %R suggest a potential pullback or consolidation, while the RSI and MACD indicate a neutral to slightly bullish sentiment. The volatility in the Bollinger Bands and the negative CMF further support a cautious outlook. Investors should closely monitor key support and resistance levels for potential entry or exit points.
Key Recommendations:
- Exercise Caution: Given the mixed signals from the indicators, it is advisable to exercise caution and wait for clearer trends to emerge.
- Set Stop-Loss Levels: Implementing stop-loss orders can help mitigate risks in case of unexpected price movements.
- Monitor Key Levels: Keep a close eye on key support and resistance levels to identify potential breakout or reversal points.
By considering these recommendations and staying informed about market developments, investors can make well-informed decisions regarding their positions in SAH stock.