Technical Analysis of SAR 2024-05-31
Overview:
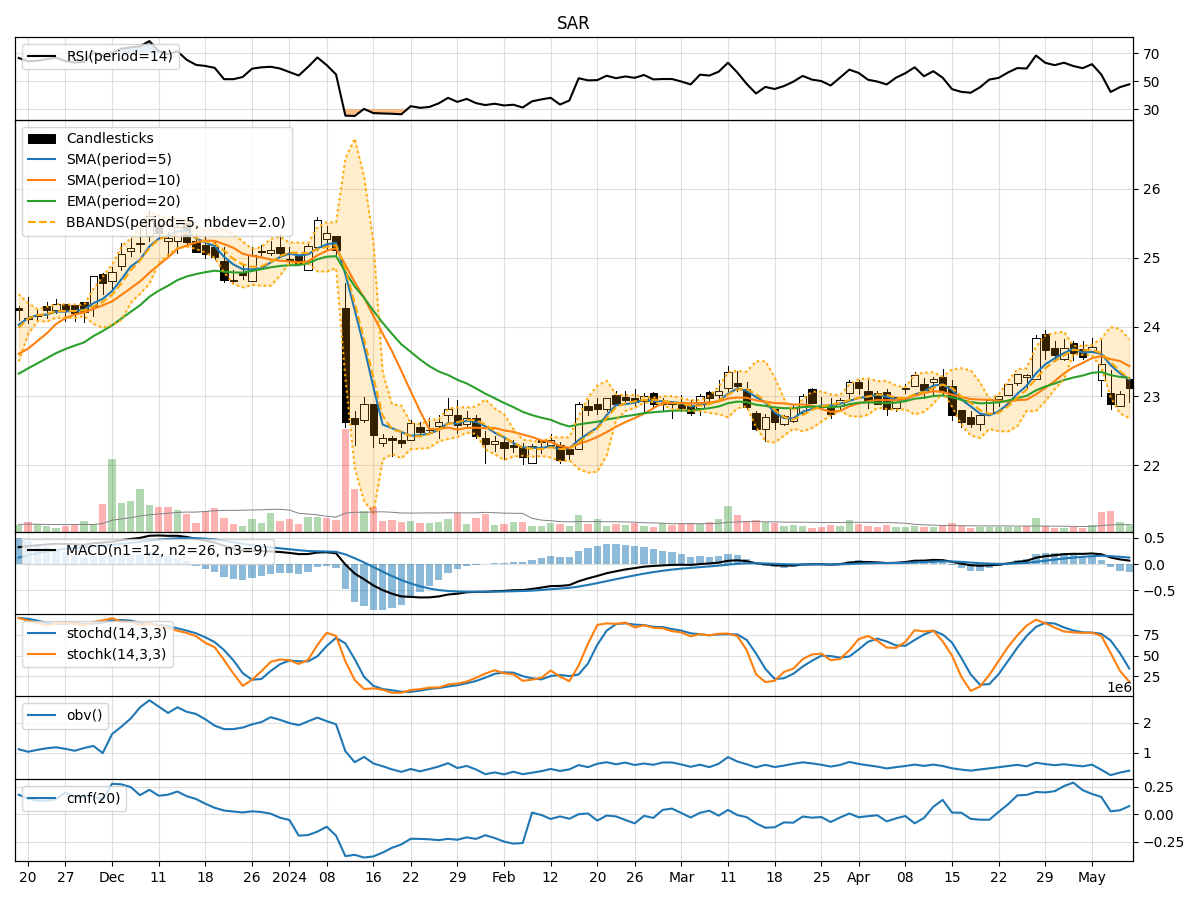
In the last 5 trading days, the stock has shown mixed signals across various technical indicators. The trend indicators suggest a slight bullish sentiment, with moving averages trending upwards. Momentum indicators show a neutral to slightly bullish stance, while volatility indicators indicate a decrease in volatility. Volume indicators, however, show a decrease in buying pressure.
Trend Indicators:
- Moving Averages (MA): The 5-day MA has been trending upwards, indicating a bullish sentiment in the short term.
- MACD: The MACD line has been consistently positive, suggesting a bullish trend.
- MACD Histogram: The MACD Histogram has been increasing, indicating strengthening bullish momentum.
Key Observation: The trend indicators point towards a bullish sentiment in the short term.
Momentum Indicators:
- RSI: The RSI has been fluctuating around the neutral zone, indicating a lack of strong momentum.
- Stochastic Oscillator: Both %K and %D have been fluctuating, showing indecision in momentum.
- Williams %R: The Williams %R is hovering around oversold levels, suggesting a potential reversal.
Key Observation: Momentum indicators are mixed, with no clear direction in momentum.
Volatility Indicators:
- Bollinger Bands (BB): The bands have been narrowing, indicating decreasing volatility.
- Bollinger %B: The %B is decreasing, suggesting a decrease in volatility.
Key Observation: Volatility indicators show a decrease in volatility, which could lead to a period of consolidation.
Volume Indicators:
- On-Balance Volume (OBV): The OBV has been fluctuating, indicating mixed buying pressure.
- Chaikin Money Flow (CMF): The CMF has been negative, suggesting a lack of buying interest.
Key Observation: Volume indicators show a decrease in buying pressure, which could lead to a potential consolidation phase.
Conclusion:
Based on the analysis of the technical indicators, the next few days' possible stock price movement is likely to be sideways or consolidating. The trend indicators suggest a bullish sentiment in the short term, but the lack of strong momentum and decreasing buying pressure indicate a potential period of consolidation. The decrease in volatility also supports the view of a sideways movement. Traders should exercise caution and wait for clearer signals before taking significant positions.
Recommendation:
- Short Term: Consider staying on the sidelines or adopting a neutral stance until clearer signals emerge.
- Long Term: Monitor the stock closely for any breakout or breakdown from the consolidation phase to determine the next major trend direction.
Remember, market conditions can change rapidly, so it's essential to stay updated with the latest developments and adjust your strategy accordingly.