Technical Analysis of SAVE 2024-05-10
Overview:
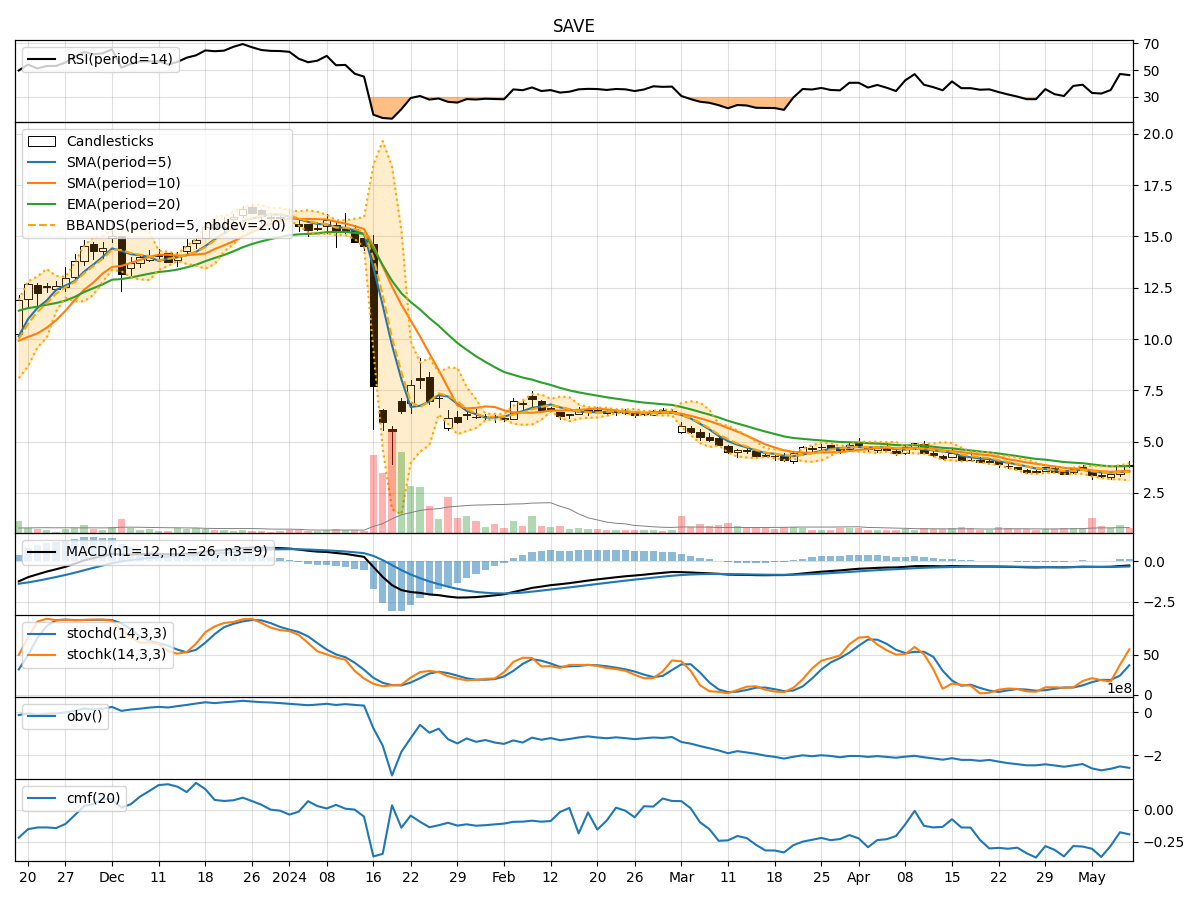
In analyzing the technical indicators for SAVE (Spirit Airlines Inc.) over the last 5 days, we will delve into the trend, momentum, volatility, and volume indicators to provide a comprehensive outlook on the possible stock price movement in the coming days.
Trend Analysis:
- Moving Averages (MA): The 5-day Moving Average (MA) has been declining, indicating a short-term bearish trend.
- MACD: The Moving Average Convergence Divergence (MACD) has been negative, suggesting a bearish momentum.
- EMA: The Exponential Moving Average (EMA) has been decreasing, aligning with the bearish sentiment in the short term.
Momentum Analysis:
- RSI: The Relative Strength Index (RSI) has been relatively low, indicating oversold conditions.
- Stochastic Oscillator: Both %K and %D have been increasing, signaling a potential bullish momentum shift.
- Williams %R: The Williams %R is in the oversold territory, hinting at a possible reversal.
Volatility Analysis:
- Bollinger Bands: The stock price has been trading within the lower Bollinger Band, suggesting a potential oversold condition.
- Bollinger %B: The %B indicator is below 1, indicating a possible undervalued situation.
Volume Analysis:
- On-Balance Volume (OBV): The OBV has been declining, reflecting selling pressure in the stock.
- Chaikin Money Flow (CMF): The CMF has been negative, indicating a bearish money flow trend.
Key Observations:
- The trend indicators point towards a bearish sentiment in the short term.
- Momentum indicators show signs of a potential bullish reversal.
- Volatility indicators suggest the stock may be oversold.
- Volume indicators reflect selling pressure in the stock.
Conclusion:
Based on the analysis of the technical indicators, the next few days for SAVE stock could see a potential bullish reversal in momentum despite the short-term bearish trend. The oversold conditions indicated by volatility indicators, coupled with the potential momentum shift highlighted by the stochastic oscillator and Williams %R, may lead to a short-term upward movement in the stock price. However, caution is advised as the overall trend remains bearish, and further confirmation is needed to validate the potential reversal.