Technical Analysis of SB 2024-05-10
Overview:
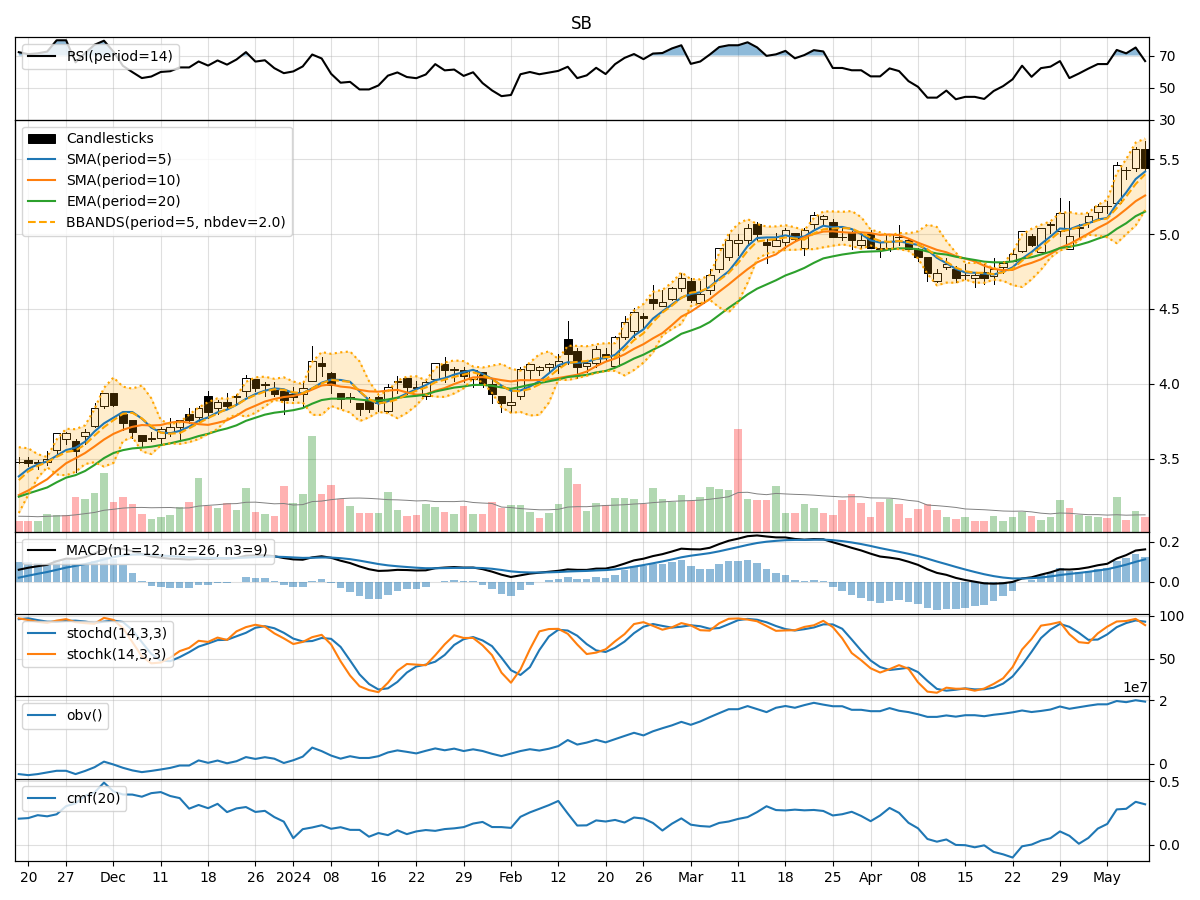
In analyzing the technical indicators for SB stock over the last 5 days, we will delve into the trends, momentum, volatility, and volume indicators to provide a comprehensive outlook on the possible stock price movement in the coming days. By examining these key factors, we aim to offer valuable insights and predictions for informed decision-making.
Trend Analysis:
- Moving Averages (MA): The 5-day Moving Average (MA) has been consistently increasing, indicating a bullish trend in the short term.
- MACD and Signal Line: The MACD line has been above the Signal line, suggesting positive momentum in the stock price.
- EMA: The Exponential Moving Average (EMA) has been trending upwards, supporting the bullish sentiment in the stock.
Momentum Analysis:
- RSI: The Relative Strength Index (RSI) has been in the overbought territory, indicating a strong bullish momentum.
- Stochastic Oscillator: Both %K and %D lines of the Stochastic Oscillator have been in the overbought zone, signaling a potential reversal or consolidation.
- Williams %R: The Williams %R is in the oversold region, suggesting a possible reversal in the stock price.
Volatility Analysis:
- Bollinger Bands: The Bollinger Bands have been widening, indicating increased volatility in the stock price.
- Bollinger %B: The %B indicator is below 1, suggesting that the stock price is trading below the lower Bollinger Band, potentially indicating an oversold condition.
Volume Analysis:
- On-Balance Volume (OBV): The OBV indicator has been trending upwards, indicating accumulation and buying pressure in the stock.
- Chaikin Money Flow (CMF): The CMF has been positive, reflecting strong buying pressure in the stock over the past 20 days.
Key Observations and Opinions:
- Trend: The stock is currently in an upward trend based on moving averages and EMA.
- Momentum: The momentum indicators suggest a strong bullish sentiment in the stock.
- Volatility: Increased volatility could lead to short-term fluctuations in the stock price.
- Volume: The rising OBV and positive CMF indicate strong buying interest in the stock.
Conclusion:
Based on the analysis of the technical indicators, the next few days' possible stock price movement for SB is likely to continue in an upward direction. The bullish trend, positive momentum, increasing buying pressure, and supportive moving averages all point towards a favorable outlook for the stock. However, traders should remain cautious of potential reversals indicated by the overbought levels in the Stochastic Oscillator and the Williams %R indicator. Overall, the outlook for SB stock appears bullish in the near term.