Technical Analysis of SBS 2024-05-10
Overview:
In analyzing the technical indicators for SBS stock over the last 5 days, we will delve into the trend, momentum, volatility, and volume indicators to provide a comprehensive outlook on the possible future stock price movement. By examining these key indicators, we aim to offer valuable insights and predictions for the upcoming trading days.
Trend Analysis:
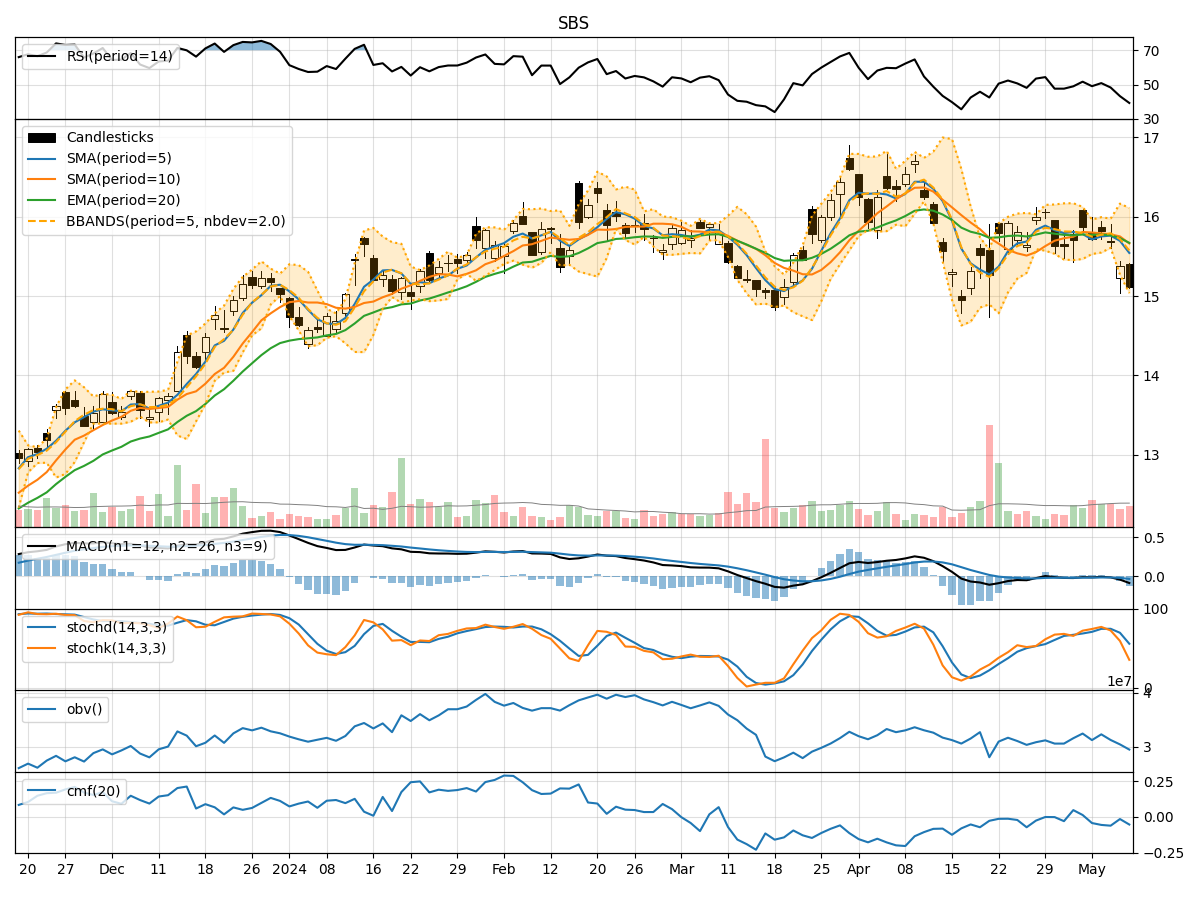
- Moving Averages (MA): The 5-day Moving Average (MA) has been declining steadily, indicating a short-term bearish trend.
- MACD: The MACD line has been consistently below the signal line, suggesting a bearish momentum in the stock price.
- RSI: The Relative Strength Index (RSI) has been decreasing, reflecting a weakening momentum in the stock.
Momentum Analysis:
- Stochastic Oscillator: Both %K and %D values have been decreasing, signaling a bearish momentum in the stock.
- Williams %R: The Williams %R indicator is in oversold territory, indicating a potential reversal or bounce in the stock price.
Volatility Analysis:
- Bollinger Bands (BB): The Bollinger Bands have widened, indicating increased volatility in the stock price.
- Bollinger %B: The %B indicator is below 0.2, suggesting the stock is oversold and may see a potential reversal.
Volume Analysis:
- On-Balance Volume (OBV): The OBV has been consistently declining, indicating selling pressure in the stock.
- Chaikin Money Flow (CMF): The CMF is negative, indicating a bearish money flow in the stock.
Key Observations:
- The stock is currently in a downtrend based on moving averages and MACD indicators.
- Momentum indicators such as RSI and Stochastic Oscillator suggest a bearish sentiment in the stock.
- Volatility has increased, as seen in the widening Bollinger Bands, indicating higher price fluctuations.
- The volume indicators reflect selling pressure with declining OBV and negative CMF values.
Conclusion:
Based on the analysis of the technical indicators, the next few days for SBS stock are likely to see a continuation of the bearish trend. The stock may experience further downside movement, potentially reaching lower price levels. Traders and investors should exercise caution and consider shorting or staying on the sidelines until there are signs of a reversal in the technical indicators.