Technical Analysis of SCI 2024-05-10
Overview:
In analyzing the technical indicators for SCI stock over the last 5 days, we will delve into the trend, momentum, volatility, and volume indicators to provide a comprehensive outlook on the possible stock price movement in the coming days. By examining these key indicators, we aim to offer valuable insights and predictions for potential investors.
Trend Analysis:
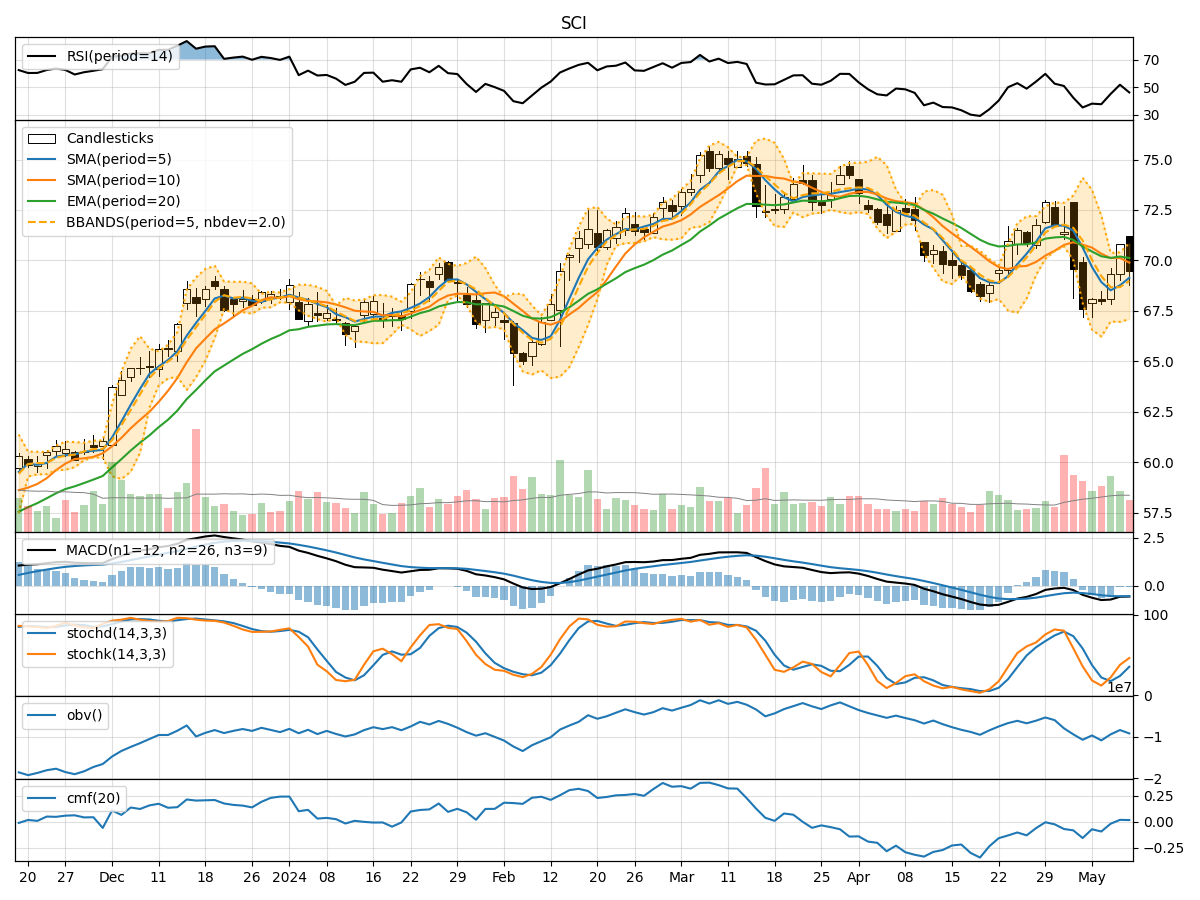
- Moving Averages (MA): The 5-day Moving Average (MA) has been fluctuating around the 69 level, indicating a short-term sideways trend.
- MACD: The Moving Average Convergence Divergence (MACD) has been negative but showing signs of convergence towards the signal line, suggesting a possible trend reversal.
- EMA: The Exponential Moving Average (EMA) has been relatively stable around 70, indicating a potential support level.
Key Observation: The trend indicators suggest a neutral to slightly bearish sentiment in the short term.
Momentum Analysis:
- RSI: The Relative Strength Index (RSI) has been oscillating around the mid-level, indicating a lack of strong momentum in either direction.
- Stochastic Oscillator: Both %K and %D have shown some improvement but remain below the overbought threshold, suggesting a potential for further upside momentum.
- Williams %R: The Williams %R is hovering in the oversold territory, indicating a possible buying opportunity.
Key Observation: Momentum indicators point towards a neutral stance with a slight bullish bias.
Volatility Analysis:
- Bollinger Bands: The Bollinger Bands have been relatively narrow, indicating low volatility in the stock price movement.
- Bollinger %B: The %B indicator has been fluctuating around the mid-level, suggesting a balanced market sentiment.
Key Observation: Volatility indicators signal a period of consolidation and stability in the stock price.
Volume Analysis:
- On-Balance Volume (OBV): The OBV has shown mixed signals with fluctuations in volume, indicating indecision among market participants.
- Chaikin Money Flow (CMF): The CMF has been negative but improving slightly, suggesting a potential inflow of money into the stock.
Key Observation: Volume indicators reflect a lack of clear direction in investor sentiment.
Conclusion:
Based on the analysis of the technical indicators, the next few days for SCI stock are likely to see sideways movement with a slightly bullish bias. The trend indicators suggest a neutral to slightly bearish outlook, while momentum indicators hint at a potential for upside momentum. Volatility indicators point towards a period of consolidation, and volume indicators indicate mixed signals.
Overall, the stock is expected to trade within a narrow range with a potential for a modest upside movement. Investors should closely monitor key support and resistance levels for potential entry and exit points.
This analysis provides a balanced view of the technical landscape for SCI stock, offering insights to help investors make informed decisions in the dynamic stock market environment.