Technical Analysis of SCM 2024-05-31
Overview:
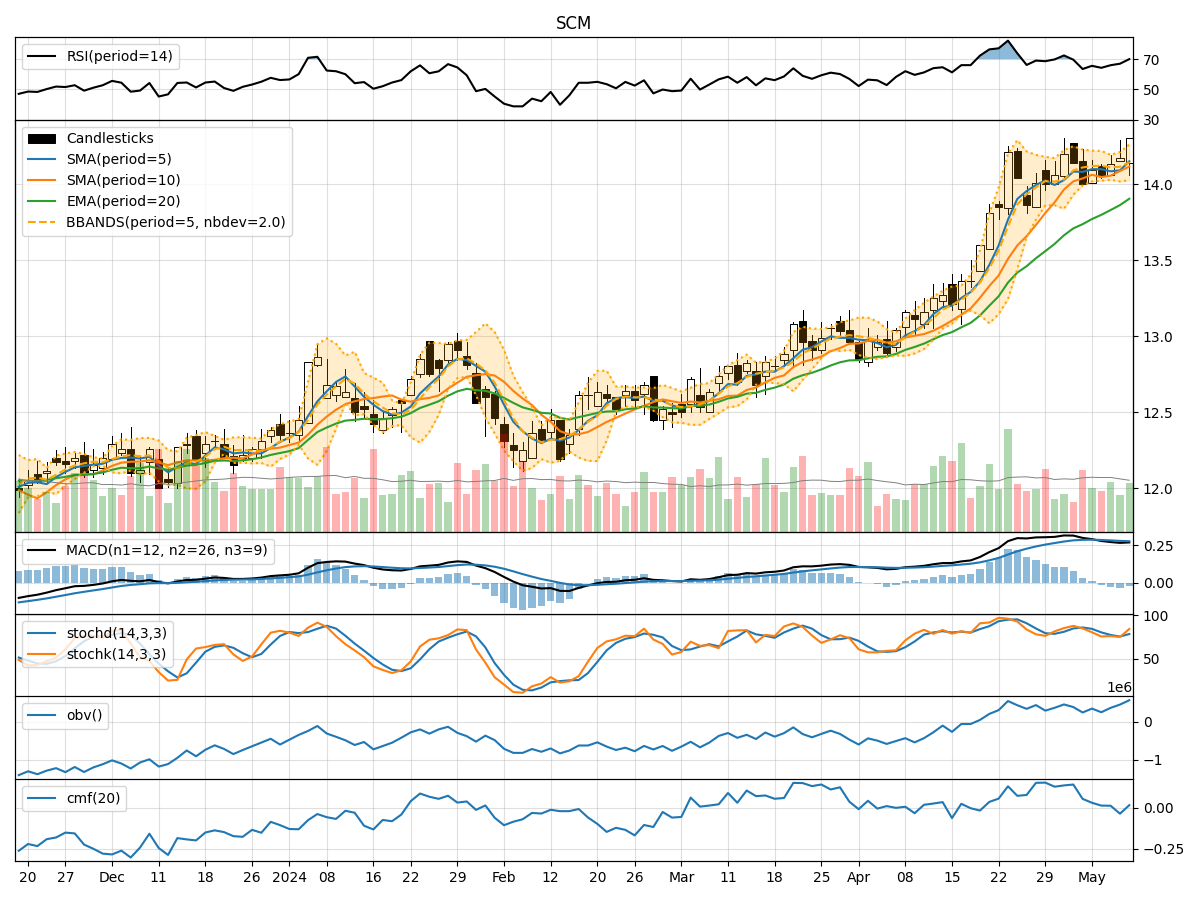
In analyzing the technical indicators for SCM stock over the last 5 days, we will delve into the trend, momentum, volatility, and volume indicators to provide a comprehensive outlook on the possible stock price movement in the coming days.
Trend Analysis:
- Moving Averages (MA): The 5-day MA has been gradually decreasing, indicating a short-term bearish trend.
- MACD: The MACD line has been consistently below the signal line, suggesting a bearish momentum.
- EMA: The EMA has been declining, aligning with the bearish sentiment in the short term.
Momentum Analysis:
- RSI: The RSI has been fluctuating around the neutral zone, indicating indecision in the market.
- Stochastic Oscillator: Both %K and %D have been rising, signaling a potential bullish momentum.
- Williams %R: The indicator has been in oversold territory, hinting at a possible reversal.
Volatility Analysis:
- Bollinger Bands: The stock price has been trading within the bands, showing no extreme volatility.
- Bollinger %B: The %B indicator has been fluctuating around the midline, suggesting a lack of clear direction.
Volume Analysis:
- On-Balance Volume (OBV): The OBV has been mixed, indicating some distribution and accumulation phases.
- Chaikin Money Flow (CMF): The CMF has been negative, reflecting selling pressure in the market.
Key Observations:
- The trend indicators point towards a short-term bearish outlook.
- Momentum indicators show conflicting signals, with RSI neutral but stochastic indicators hinting at a potential bullish reversal.
- Volatility remains relatively stable, with no significant price swings.
- Volume indicators suggest a mix of buying and selling pressure in the market.
Conclusion:
Based on the analysis of the technical indicators, the stock price of SCM is likely to experience a period of consolidation in the coming days. The conflicting signals from momentum indicators may lead to choppy price action, while the stable volatility indicates a lack of significant price movements. Traders should exercise caution and wait for clearer signals before taking any significant positions.