Technical Analysis of SEE 2024-05-10
Overview:
In analyzing the technical indicators for SEE stock over the last 5 days, we will delve into the trend, momentum, volatility, and volume indicators to provide a comprehensive outlook on the possible stock price movement in the coming days. By examining these key indicators, we aim to offer valuable insights and predictions for potential investors.
Trend Analysis:
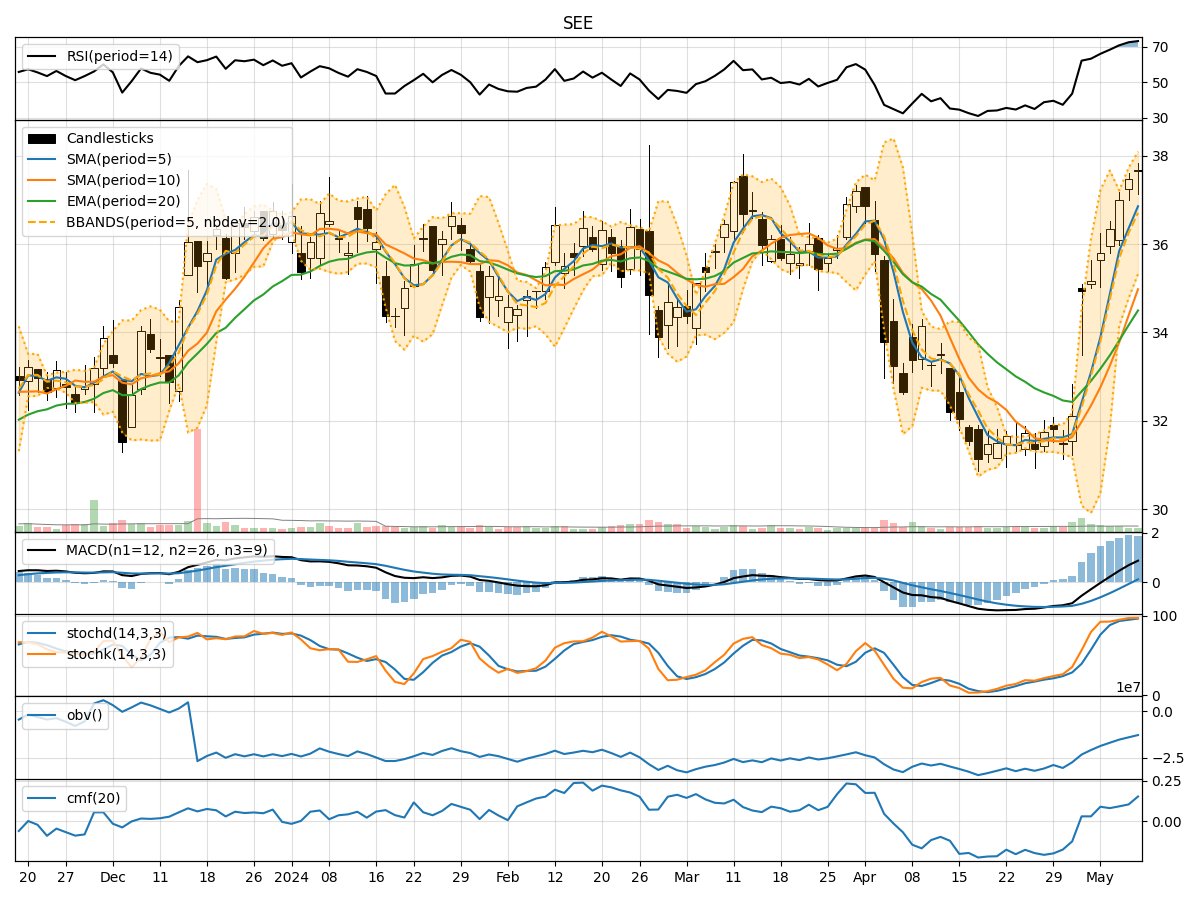
- Moving Averages (MA): The 5-day Moving Average has been consistently rising, indicating a bullish trend in the short term.
- MACD: The MACD line has been above the signal line for the past 5 days, suggesting a bullish momentum.
- EMA: The Exponential Moving Average has also been trending upwards, supporting the bullish sentiment.
Momentum Analysis:
- RSI: The Relative Strength Index has been in the overbought territory, indicating a strong bullish momentum.
- Stochastic Oscillator: Both %K and %D have been in the overbought zone, signaling a strong buying pressure.
- Williams %R: The indicator has been consistently in the oversold region, further confirming the bullish momentum.
Volatility Analysis:
- Bollinger Bands: The stock price has been trading above the upper Bollinger Band, suggesting an overbought condition.
- Bollinger %B: The %B indicator has been above 0.8, indicating a potential overvaluation of the stock.
- Average True Range (ATR): The ATR has been increasing, signifying rising volatility in the stock.
Volume Analysis:
- On-Balance Volume (OBV): The OBV has been steadily increasing, reflecting strong buying volume in the stock.
- Chaikin Money Flow (CMF): The CMF has been positive, indicating that money is flowing into the stock.
Key Observations:
- The technical indicators collectively suggest a strong bullish sentiment in the stock.
- The stock is currently in an overbought condition based on various momentum and volatility indicators.
- The increasing volume and positive money flow indicate strong buying interest in the stock.
Conclusion:
Based on the analysis of the trend, momentum, volatility, and volume indicators, the next few days' possible stock price movement for SEE is likely to be upward. However, considering the overbought condition and potential overvaluation indicated by some indicators, there might be a short-term correction or consolidation before the uptrend resumes. Investors should closely monitor the price action and key support levels to make informed trading decisions.