Technical Analysis of SF 2024-05-10
Overview:
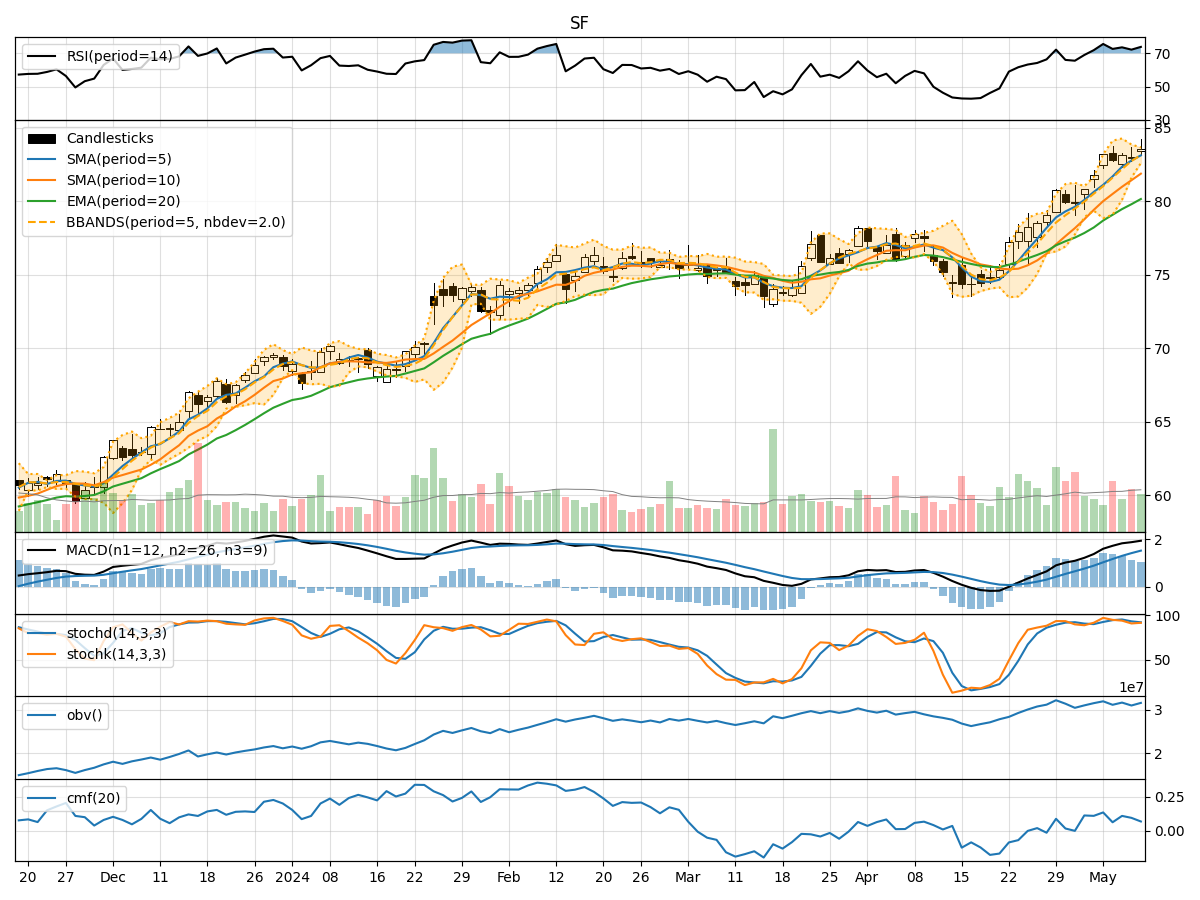
In the last 5 trading days, the stock price of SF has shown some fluctuations but generally maintained an upward trend. Various technical indicators provide insights into the stock's potential future movements. Let's analyze the trend, momentum, volatility, and volume indicators to make informed predictions.
Trend Indicators:
- Moving Averages (MA): The 5-day MA has been consistently above the longer-term SMAs and EMAs, indicating a bullish trend.
- MACD: The MACD line has been above the signal line, with both lines showing an upward trajectory, suggesting continued bullish momentum.
- RSI: The RSI values have been relatively high, indicating overbought conditions but also reflecting strong buying momentum.
Momentum Indicators:
- Stochastic Oscillator: The Stochastic Oscillator has been fluctuating but generally staying in the overbought territory, suggesting a strong bullish momentum.
- Williams %R (Willr): The Willr values have been negative but improving, indicating a potential reversal in the short term.
Volatility Indicators:
- Bollinger Bands (BB): The stock price has been trading within the upper Bollinger Band, indicating an overbought condition but also potential for further upside.
- Volatility: The volatility has been decreasing, which could signal a period of consolidation or a potential reversal in the stock price.
Volume Indicators:
- On-Balance Volume (OBV): The OBV has been increasing, indicating strong buying pressure and accumulation of the stock.
- Chaikin Money Flow (CMF): The CMF has been positive, reflecting buying pressure in the stock.
Conclusion:
Based on the analysis of the technical indicators: - Trend: The stock is in a strong upward trend. - Momentum: The momentum indicators suggest a continuation of the bullish trend. - Volatility: The decreasing volatility may lead to a period of consolidation or a minor pullback. - Volume: The increasing OBV and positive CMF indicate strong buying interest in the stock.
Forecast:
Given the overall bullish sentiment in the technical indicators, the next few days are likely to see continued upward movement in the stock price of SF. Traders and investors can consider buying opportunities on pullbacks or consolidations to ride the bullish trend. It is essential to monitor the indicators for any signs of reversal or weakening bullish momentum.