Technical Analysis of SGHC 2024-05-10
Overview:
In analyzing the technical indicators for SGHC over the last 5 days, we will delve into the trend, momentum, volatility, and volume indicators to provide a comprehensive outlook on the possible stock price movement in the coming days.
Trend Analysis:
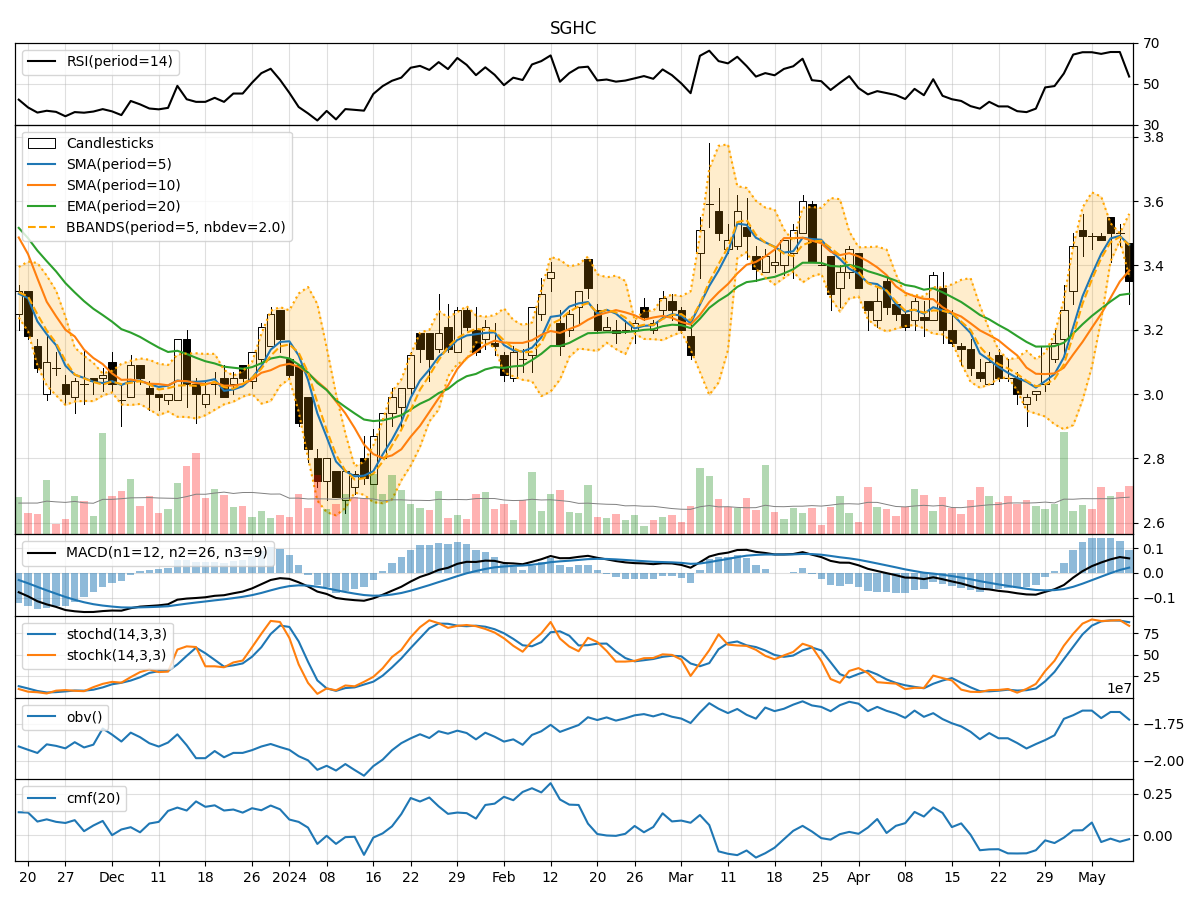
- Moving Averages (MA): The 5-day Moving Average (MA) has been fluctuating around the closing prices, indicating short-term price trends. The Simple Moving Average (SMA) and Exponential Moving Average (EMA) have been showing an upward trend, suggesting a bullish sentiment.
- MACD: The Moving Average Convergence Divergence (MACD) has been positive, with the MACD line consistently above the signal line, indicating bullish momentum.
Momentum Analysis:
- RSI: The Relative Strength Index (RSI) has been in the neutral to overbought territory, suggesting a potential reversal or consolidation.
- Stochastic Oscillator: Both %K and %D have been relatively high, indicating overbought conditions.
Volatility Analysis:
- Bollinger Bands (BB): The Bollinger Bands have been narrowing, indicating decreasing volatility and a potential price breakout.
Volume Analysis:
- On-Balance Volume (OBV): The OBV has been fluctuating, indicating mixed buying and selling pressure.
- Chaikin Money Flow (CMF): The CMF has been negative, suggesting a bearish sentiment in the market.
Key Observations:
- The trend indicators suggest a bullish sentiment in the short term.
- Momentum indicators indicate potential overbought conditions and a need for caution.
- Volatility indicators point towards a potential price breakout.
- Volume indicators show mixed signals with fluctuating buying and selling pressure.
Conclusion:
Based on the analysis of the technical indicators, the next few days' possible stock price movement for SGHC is likely to be bullish in the short term. However, caution is advised due to the overbought conditions indicated by the momentum indicators. Traders should closely monitor the price action for any signs of a reversal or consolidation. Additionally, a breakout from the narrowing Bollinger Bands could signal a significant price movement.