Technical Analysis of SHO 2024-05-10
Overview:
In analyzing the technical indicators for the stock SHO over the last 5 days, we will delve into the trends, momentum, volatility, and volume indicators to provide a comprehensive outlook on the possible future stock price movement. By examining these key aspects, we aim to offer valuable insights and recommendations for potential investors.
Trend Analysis:
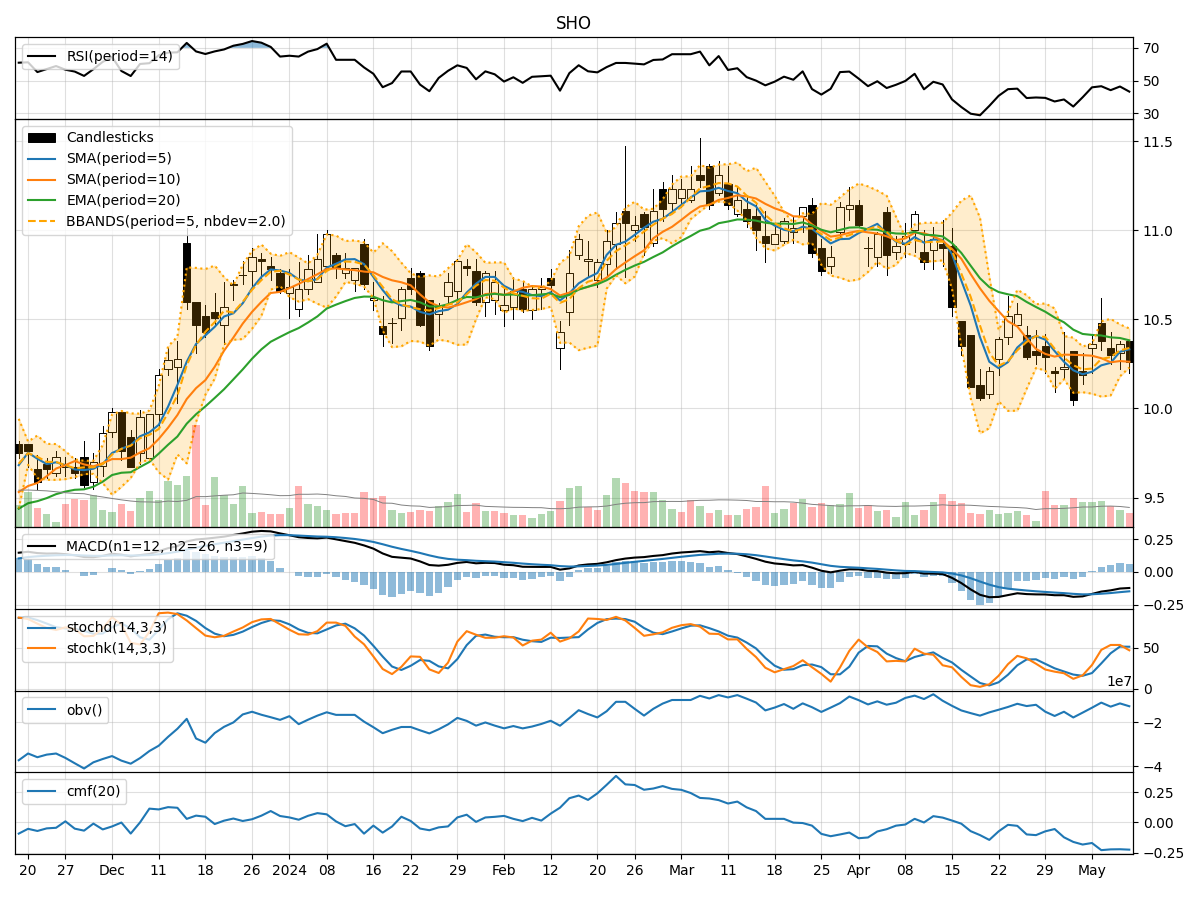
- Moving Averages (MA): The 5-day Moving Average (MA) has been fluctuating around the closing prices, indicating short-term price trends. The Simple Moving Average (SMA) and Exponential Moving Average (EMA) show a slight downward trend, suggesting a potential bearish sentiment.
- Moving Average Convergence Divergence (MACD): The MACD and Signal line have been consistently negative, indicating a bearish trend in the stock price momentum.
Momentum Analysis:
- Relative Strength Index (RSI): The RSI values have been hovering around the mid-range, indicating a neutral sentiment with no clear overbought or oversold conditions.
- Stochastic Oscillator: The Stochastic indicators suggest a mixed sentiment, with the %K and %D values fluctuating but not indicating any extreme conditions.
Volatility Analysis:
- Bollinger Bands (BB): The Bollinger Bands have been narrowing, suggesting decreasing volatility in the stock price. The bands are relatively close to the moving average, indicating a period of consolidation.
- Bollinger Percent B (BBP): The Percent B values are low, indicating that the stock price is currently trading near the lower band, potentially signaling an oversold condition.
Volume Analysis:
- On-Balance Volume (OBV): The OBV values have been fluctuating, indicating mixed buying and selling pressure in the stock. There is no clear trend in volume accumulation.
- Chaikin Money Flow (CMF): The CMF values have been negative, suggesting that money may be flowing out of the stock, indicating a bearish sentiment.
Conclusion:
Based on the analysis of the technical indicators, the stock SHO is currently exhibiting a bearish sentiment. The trend indicators show a downward trajectory, supported by the negative MACD values. The momentum indicators suggest a neutral stance with no clear signals of overbought or oversold conditions. The volatility indicators point towards a period of consolidation with decreasing volatility. The volume indicators indicate mixed buying and selling pressure, with money flowing out of the stock.
Recommendation:
Considering the overall bearish sentiment and lack of strong positive signals in the technical indicators, it is advisable to exercise caution when considering investments in SHO. Investors may want to wait for more definitive signals of a potential reversal or upward trend before considering long positions. Short-term traders could explore opportunities to capitalize on the current downward momentum with appropriate risk management strategies in place.