Technical Analysis of SITE 2024-05-10
Overview:
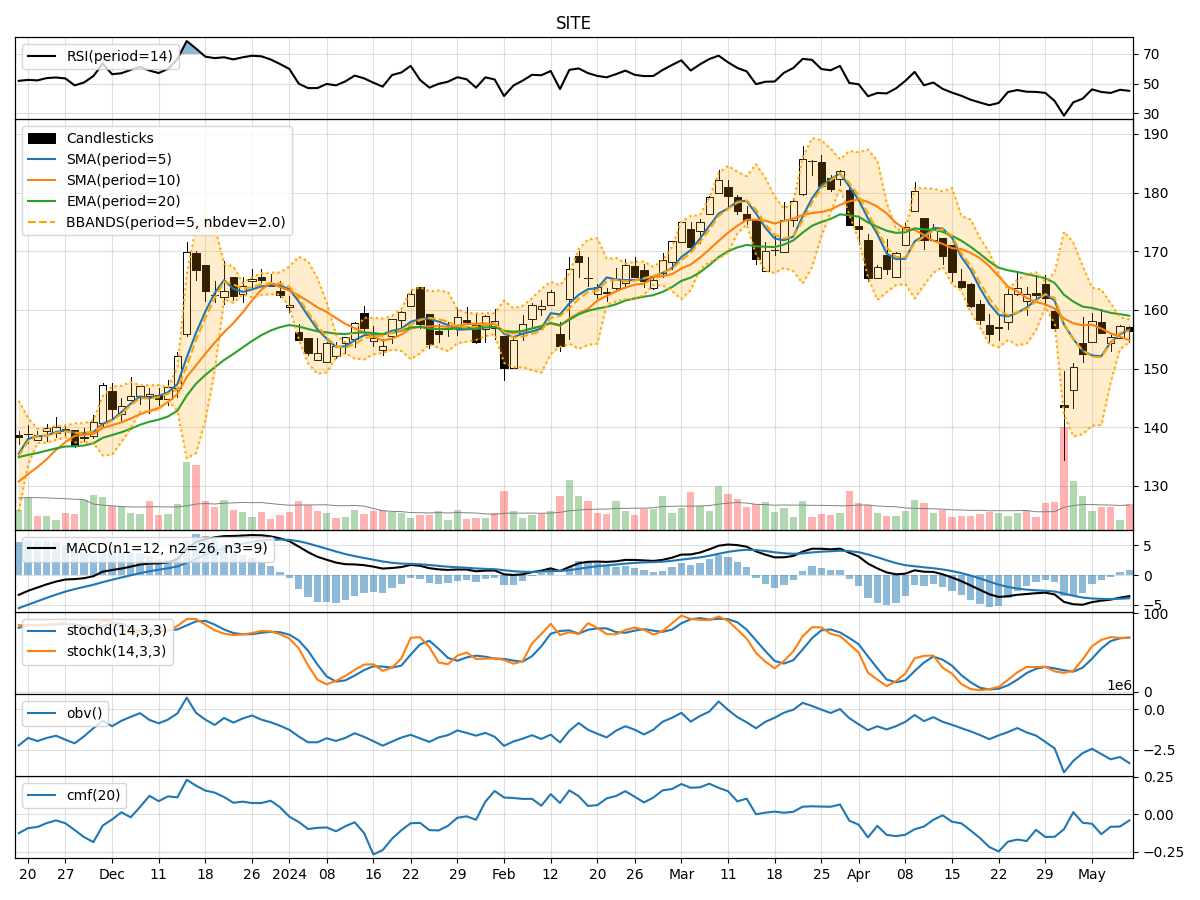
In analyzing the technical indicators for the stock of SITE over the last 5 days, we will delve into the trend, momentum, volatility, and volume indicators to provide a comprehensive outlook on the possible stock price movement in the coming days.
Trend Analysis:
- Moving Averages (MA): The 5-day Moving Average (MA) has been fluctuating around the Simple Moving Average (SMA) and Exponential Moving Average (EMA) values, indicating a lack of clear trend direction.
- MACD: The Moving Average Convergence Divergence (MACD) has been negative, suggesting a bearish momentum in the short term.
- Conclusion: The trend indicators point towards a sideways movement with a slight bearish bias.
Momentum Analysis:
- RSI: The Relative Strength Index (RSI) has been hovering around the mid-level, indicating a neutral momentum.
- Stochastic Oscillator: Both %K and %D have been in the overbought territory, suggesting a potential reversal.
- Conclusion: The momentum indicators suggest a neutral to slightly bearish momentum in the near future.
Volatility Analysis:
- Bollinger Bands (BB): The bands have been narrowing, indicating decreasing volatility.
- Conclusion: The volatility indicators signal a decreasing volatility environment.
Volume Analysis:
- On-Balance Volume (OBV): The OBV has been declining, indicating selling pressure.
- Chaikin Money Flow (CMF): The CMF has been negative, reflecting a lack of buying interest.
- Conclusion: The volume indicators suggest a bearish sentiment in the market.
Conclusion:
Based on the analysis of the trend, momentum, volatility, and volume indicators, the overall outlook for SITE stock in the next few days is bearish with a sideways movement expected. Traders should exercise caution and consider potential short-term selling opportunities. It is advisable to closely monitor key support levels for any potential breakdowns.