Technical Analysis of SKLZ 2024-05-10
Overview:
In analyzing the technical indicators for SKLZ over the last 5 days, we will delve into the trend, momentum, volatility, and volume indicators to provide a comprehensive outlook on the possible stock price movement in the coming days. By examining these key aspects, we aim to offer valuable insights and predictions for potential investors.
Trend Analysis:
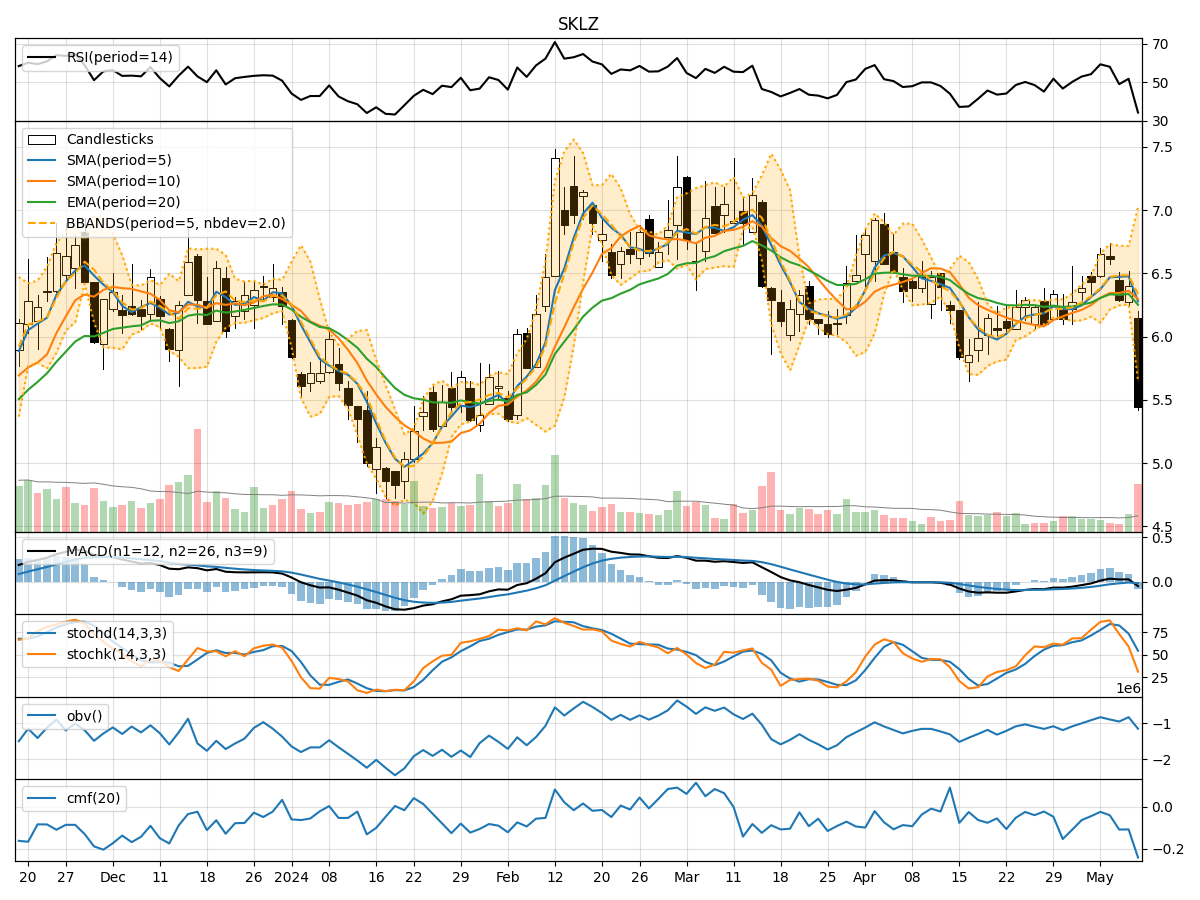
- Moving Averages (MA): The 5-day Moving Average (MA) has been fluctuating around the closing prices, indicating short-term price trends. The Simple Moving Average (SMA) and Exponential Moving Average (EMA) show a mixed trend.
- MACD: The Moving Average Convergence Divergence (MACD) has been mostly positive, suggesting bullish momentum.
- Conclusion: The trend indicators suggest a mixed outlook with some bullish signals from the MACD.
Momentum Analysis:
- RSI: The Relative Strength Index (RSI) has been fluctuating but generally staying within the neutral range, indicating indecision in the market.
- Stochastic Oscillator: Both %K and %D have been declining, showing a loss in momentum.
- Conclusion: The momentum indicators point towards a weakening momentum in the stock.
Volatility Analysis:
- Bollinger Bands (BB): The Bollinger Bands have widened, indicating increased volatility in the stock price.
- Conclusion: The volatility indicators suggest higher volatility in the stock, which could lead to significant price swings.
Volume Analysis:
- On-Balance Volume (OBV): The OBV has been fluctuating, indicating mixed buying and selling pressure.
- Chaikin Money Flow (CMF): The CMF has been negative, suggesting a bearish money flow.
- Conclusion: The volume indicators reflect mixed trading activity with a bearish bias from the CMF.
Overall Conclusion:
Based on the analysis of the technical indicators, the next few days for SKLZ could see further downside movement. The weakening momentum, mixed trend signals, higher volatility, and bearish volume indicators all point towards a potential continuation of the current downtrend. Traders and investors should exercise caution and consider risk management strategies in their decision-making process.
Key Points:
- Trend: Mixed signals, but leaning towards bearish.
- Momentum: Weakening momentum favors downside movement.
- Volatility: Increased volatility could lead to sharp price swings.
- Volume: Bearish volume indicators suggest selling pressure.
Recommendation:
Given the overall bearish outlook, it would be prudent to exercise caution and consider waiting for more clarity in the price action before considering any long positions. Short-term traders may find opportunities to capitalize on the increased volatility, but risk management is crucial in such market conditions. Long-term investors should monitor the situation closely and wait for more favorable entry points.
Disclaimer:
This analysis is based solely on technical indicators and does not take into account fundamental factors that may impact the stock price. It is essential to conduct thorough research and consider all aspects of investing before making any trading decisions.