Technical Analysis of SLCA 2024-05-10
Overview:
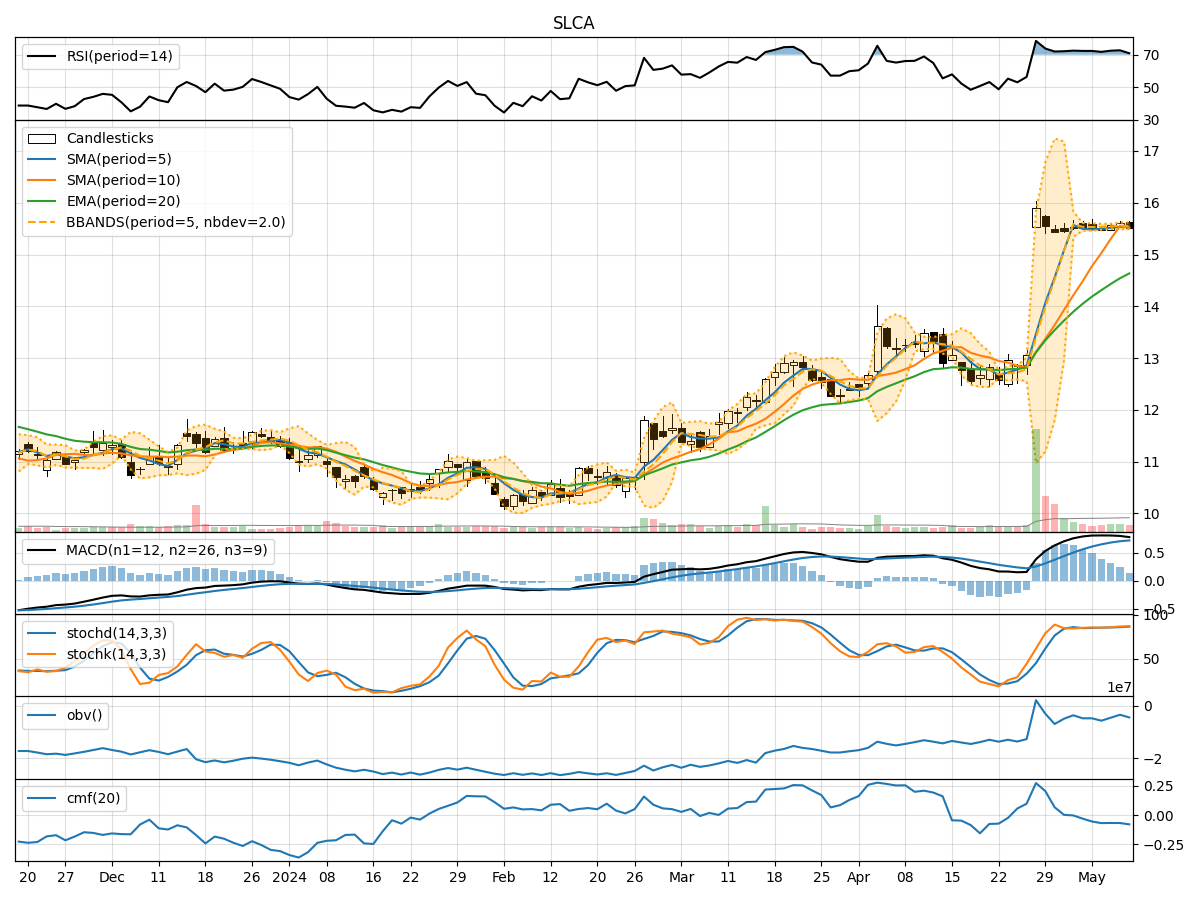
In analyzing the technical indicators for SLCA over the last 5 days, we will delve into the trend, momentum, volatility, and volume indicators to provide a comprehensive outlook on the possible stock price movement in the coming days. By examining key metrics such as moving averages, MACD, RSI, Bollinger Bands, and OBV, we aim to offer valuable insights and predictions for potential price action.
Trend Indicators:
- Moving Averages (MA): The 5-day MA has been relatively stable around the closing prices, indicating a consistent trend.
- MACD: The MACD line has shown a slight decrease over the last 5 days, but the MACD histogram has been positive, suggesting a potential bullish momentum.
- EMA: The EMA has been steadily increasing, reflecting a positive trend in the stock price.
Momentum Indicators:
- RSI: The RSI has been in the overbought territory, indicating a strong bullish momentum in the stock.
- Stochastic Oscillator: Both %K and %D have been in the overbought zone, signaling a potential reversal or consolidation in the near future.
- Williams %R: The Williams %R has been consistently in the oversold region, suggesting a bearish sentiment.
Volatility Indicators:
- Bollinger Bands: The stock price has been trading within the Bollinger Bands, indicating a period of consolidation and potential breakout in either direction.
- Bollinger Band Width: The Band Width has been relatively narrow, suggesting low volatility and a possible impending price movement.
Volume Indicators:
- On-Balance Volume (OBV): The OBV has shown a slight decrease over the last 5 days, indicating a potential distribution phase.
- Chaikin Money Flow (CMF): The CMF has been negative, suggesting selling pressure in the stock.
Key Observations and Opinions:
- Trend: The stock has been in an overall uptrend, supported by the moving averages and EMA.
- Momentum: The RSI and Stochastic Oscillator indicate a strong bullish sentiment, but the Williams %R suggests a potential reversal.
- Volatility: The Bollinger Bands and Band Width point towards a period of consolidation and a potential breakout.
- Volume: The OBV and CMF indicate a slight decrease in buying pressure and potential distribution.
Conclusion:
Based on the analysis of the technical indicators, the stock is currently in a bullish phase with strong momentum and a positive trend. However, the overbought conditions in the RSI and Stochastic Oscillator, coupled with the negative CMF, suggest a potential short-term consolidation or pullback in the stock price. Traders should closely monitor the key support and resistance levels for potential entry or exit points.