Technical Analysis of SLGN 2024-05-10
Overview:
In analyzing the technical indicators for SLGN over the last 5 days, we will delve into the trend, momentum, volatility, and volume indicators to provide a comprehensive outlook on the possible stock price movement in the coming days.
Trend Analysis:
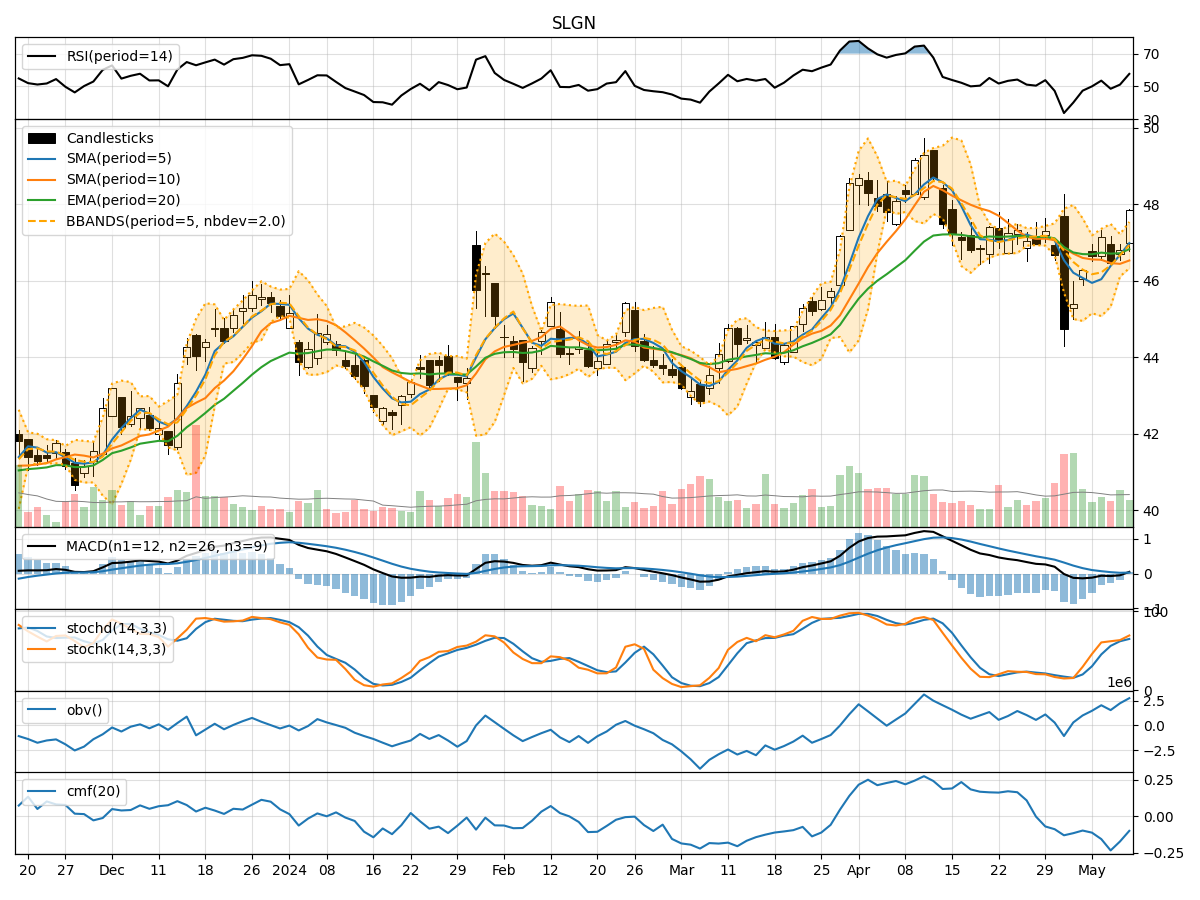
- Moving Averages (MA): The 5-day Moving Average (MA) has been fluctuating around the closing prices, indicating short-term price trends. The Simple Moving Average (SMA) and Exponential Moving Average (EMA) show a slight convergence but remain close to the closing prices.
- Moving Average Convergence Divergence (MACD): The MACD line has been fluctuating around the signal line, with the MACD Histogram showing minimal divergence.
Momentum Analysis:
- Relative Strength Index (RSI): The RSI has been oscillating within the neutral range, indicating a balanced momentum between buying and selling pressure.
- Stochastic Oscillator: Both %K and %D lines of the Stochastic Oscillator have been trending upwards, suggesting increasing buying momentum.
- Williams %R (Willams %R): The Williams %R has been fluctuating in the oversold and neutral zones, indicating potential buying opportunities.
Volatility Analysis:
- Bollinger Bands (BB): The Bollinger Bands have been relatively narrow, suggesting low volatility in the stock price movement.
Volume Analysis:
- On-Balance Volume (OBV): The OBV has shown a slight increase, indicating a potential accumulation of the stock.
- Chaikin Money Flow (CMF): The CMF has been negative, indicating a slight outflow of money from the stock.
Key Observations:
- The stock has been trading within a narrow range with minimal price fluctuations.
- Momentum indicators show a slight bullish bias with increasing buying pressure.
- Volatility remains low, indicating a lack of significant price movements.
- Volume indicators suggest a neutral to slightly bearish sentiment.
Conclusion:
Based on the analysis of the technical indicators, the stock is likely to continue trading sideways in the near term with a potential for a slight upward bias. Investors should exercise caution as the lack of significant volatility and volume may lead to limited price movements. Consider monitoring for a breakout above key resistance levels for a potential bullish trend confirmation.