Technical Analysis of SMAR 2024-05-10
Overview:
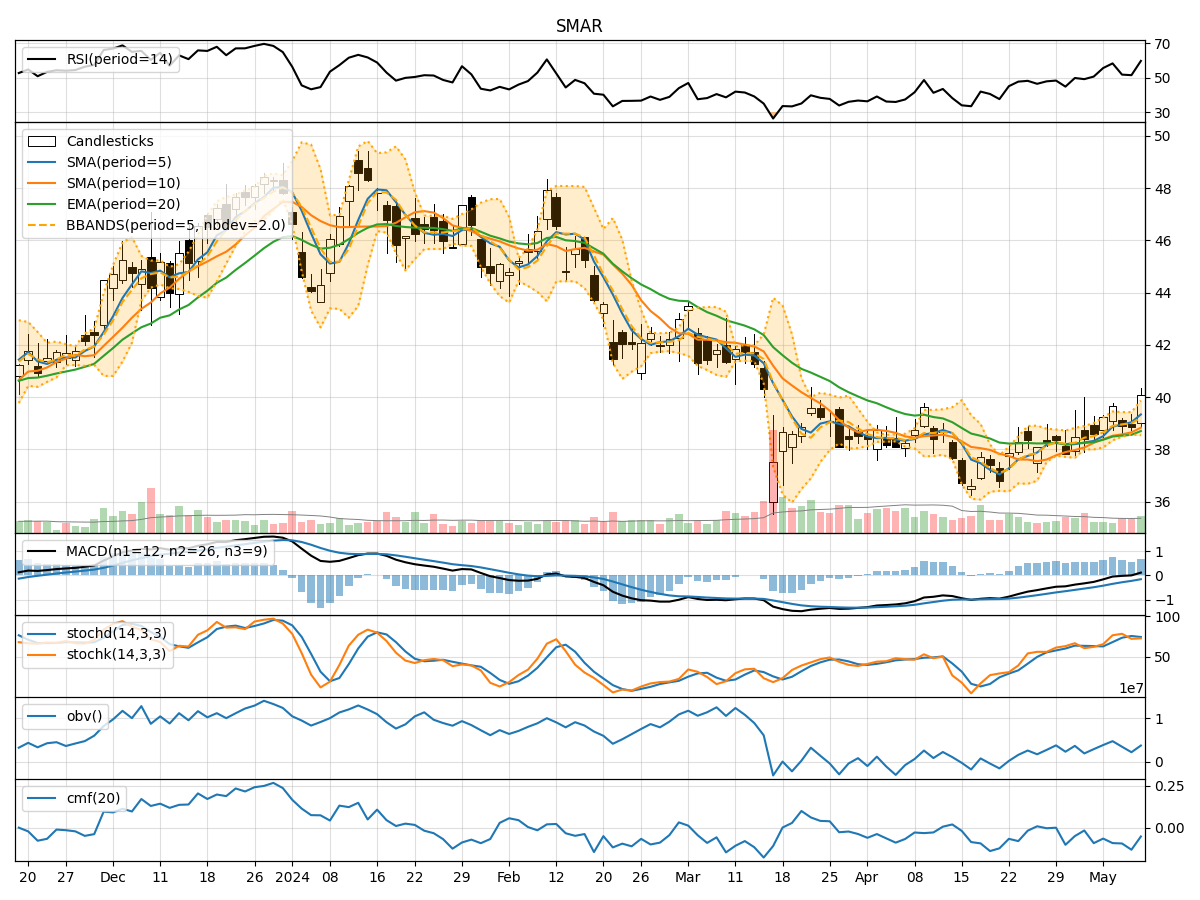
In analyzing the technical indicators for SMAR over the last 5 days, we will delve into the trend, momentum, volatility, and volume indicators to provide a comprehensive outlook on the possible stock price movement. By examining these key aspects, we aim to offer valuable insights and predictions for the upcoming days.
Trend Analysis:
- Moving Averages (MA): The 5-day Moving Average (MA) has been consistently above the Simple Moving Average (SMA) and Exponential Moving Average (EMA), indicating a bullish trend.
- MACD: The MACD line has been positive, with the MACD Histogram showing an increasing trend, suggesting bullish momentum.
Momentum Analysis:
- RSI: The Relative Strength Index (RSI) has been fluctuating around the neutral zone, indicating indecision in the market.
- Stochastic Oscillator: The Stochastic indicators have shown mixed signals, with the %K line hovering around 70, suggesting a potential overbought condition.
Volatility Analysis:
- Bollinger Bands (BB): The Bollinger Bands have been widening, indicating increased volatility in the stock price.
Volume Analysis:
- On-Balance Volume (OBV): The OBV has been fluctuating, suggesting a lack of clear direction in terms of buying or selling pressure.
- Chaikin Money Flow (CMF): The CMF has been negative, indicating a bearish money flow trend.
Key Observations:
- The trend indicators suggest a bullish sentiment in the short term.
- Momentum indicators show mixed signals, indicating potential indecision among traders.
- Volatility has been increasing, which could lead to larger price swings.
- Volume indicators reflect uncertainty in market participation and direction.
Conclusion:
Based on the analysis of the technical indicators, the stock price of SMAR is likely to experience further upward movement in the next few days. The bullish trend indicated by moving averages and MACD, coupled with increasing volatility, suggests potential price appreciation. However, caution is advised due to mixed signals from momentum indicators and uncertain volume trends. Traders should closely monitor price action and key support/resistance levels for timely decision-making.
Recommendation:
- Short-term Traders: Consider taking long positions with tight stop-loss orders to capitalize on the expected upward movement.
- Long-term Investors: Monitor the price action closely and consider accumulating positions on pullbacks for potential long-term gains.
By combining technical analysis with market insights, traders and investors can make informed decisions aligned with the prevailing market dynamics.